Graphic design is a profession, academic discipline and applied art whose activity consists in projecting visual communications intended to transmit specific messages to social groups, with specific objectives. Graphic design is an interdisciplinary branch of design and of the fine arts. Its practice involves creativity, innovation and lateral thinking using manual or digital tools, where it is usual to use text and graphics to communicate visually.

Technical drawing, drafting or drawing, is the act and discipline of composing drawings that visually communicate how something functions or is constructed.

An illustration is a decoration, interpretation, or visual explanation of a text, concept, or process, designed for integration in print and digitally published media, such as posters, flyers, magazines, books, teaching materials, animations, video games and films. An illustration is typically created by an illustrator. Digital illustrations are often used to make websites and apps more user-friendly, such as the use of emojis to accompany digital type. Illustration also means providing an example; either in writing or in picture form.

An illustrator is an artist who specializes in enhancing writing or elucidating concepts by providing a visual representation that corresponds to the content of the associated text or idea. The illustration may be intended to clarify complicated concepts or objects that are difficult to describe textually, which is the reason illustrations are often found in children's books.
Graphics are visual images or designs on some surface, such as a wall, canvas, screen, paper, or stone, to inform, illustrate, or entertain. In contemporary usage, it includes a pictorial representation of data, as in design and manufacture, in typesetting and the graphic arts, and in educational and recreational software. Images that are generated by a computer are called computer graphics.

Axonometric projection is a type of orthographic projection used for creating a pictorial drawing of an object, where the object is rotated around one or more of its axes to reveal multiple sides.
Oblique projection is a simple type of technical drawing of graphical projection used for producing two-dimensional (2D) images of three-dimensional (3D) objects.

Scientific visualization is an interdisciplinary branch of science concerned with the visualization of scientific phenomena. It is also considered a subset of computer graphics, a branch of computer science. The purpose of scientific visualization is to graphically illustrate scientific data to enable scientists to understand, illustrate, and glean insight from their data. Research into how people read and misread various types of visualizations is helping to determine what types and features of visualizations are most understandable and effective in conveying information.
A diagram is a symbolic representation of information using visualization techniques. Diagrams have been used since prehistoric times on walls of caves, but became more prevalent during the Enlightenment. Sometimes, the technique uses a three-dimensional visualization which is then projected onto a two-dimensional surface. The word graph is sometimes used as a synonym for diagram.

Visualization or visualisation is any technique for creating images, diagrams, or animations to communicate a message. Visualization through visual imagery has been an effective way to communicate both abstract and concrete ideas since the dawn of humanity. from history include cave paintings, Egyptian hieroglyphs, Greek geometry, and Leonardo da Vinci's revolutionary methods of technical drawing for engineering and scientific purposes.

Visual communication is the use of visual elements to convey ideas and information which include signs, typography, drawing, graphic design, illustration, industrial design, advertising, animation, and electronic resources. Humans have used visual communication since prehistoric times. Within modern culture, there are several types of characteristics when it comes to visual elements, they consist of objects, models, graphs, diagrams, maps, and photographs. Outside the different types of characteristics and elements, there are seven components of visual communication: color, shape, tones, texture, figure-ground, balance, and hierarchy.

Infographics are graphic visual representations of information, data, or knowledge intended to present information quickly and clearly. They can improve cognition by using graphics to enhance the human visual system's ability to see patterns and trends. Similar pursuits are information visualization, data visualization, statistical graphics, information design, or information architecture. Infographics have evolved in recent years to be for mass communication, and thus are designed with fewer assumptions about the readers' knowledge base than other types of visualizations. Isotypes are an early example of infographics conveying information quickly and easily to the masses.
Clipping, in the context of computer graphics, is a method to selectively enable or disable rendering operations within a defined region of interest. Mathematically, clipping can be described using the terminology of constructive geometry. A rendering algorithm only draws pixels in the intersection between the clip region and the scene model. Lines and surfaces outside the view volume are removed.
In three-dimensional geometry, a parallel projection is a projection of an object in three-dimensional space onto a fixed plane, known as the projection plane or image plane, where the rays, known as lines of sight or projection lines, are parallel to each other. It is a basic tool in descriptive geometry. The projection is called orthographic if the rays are perpendicular (orthogonal) to the image plane, and oblique or skew if they are not.
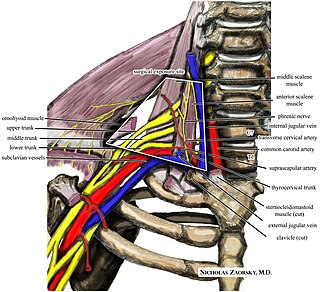
A medical illustration is a form of biological illustration that helps to record and disseminate medical, anatomical, and related knowledge.
Graphic design careers include creative director, art director, art production manager, brand identity developer, illustrator and layout artist.

Data and information visualization is the practice of designing and creating easy-to-communicate and easy-to-understand graphic or visual representations of a large amount of complex quantitative and qualitative data and information with the help of static, dynamic or interactive visual items. Typically based on data and information collected from a certain domain of expertise, these visualizations are intended for a broader audience to help them visually explore and discover, quickly understand, interpret and gain important insights into otherwise difficult-to-identify structures, relationships, correlations, local and global patterns, trends, variations, constancy, clusters, outliers and unusual groupings within data. When intended for the general public to convey a concise version of known, specific information in a clear and engaging manner, it is typically called information graphics.

Graphic communication as the name suggests is communication using graphic elements. These elements include symbols such as glyphs and icons, images such as drawings and photographs, and can include the passive contributions of substrate, colour and surroundings. It is the process of creating, producing, and distributing material incorporating words and images to convey data, concepts, and emotions.
In technical drawing and computer graphics, a multiview projection is a technique of illustration by which a standardized series of orthographic two-dimensional pictures are constructed to represent the form of a three-dimensional object. Up to six pictures of an object are produced, with each projection plane parallel to one of the coordinate axes of the object. The views are positioned relative to each other according to either of two schemes: first-angle or third-angle projection. In each, the appearances of views may be thought of as being projected onto planes that form a six-sided box around the object. Although six different sides can be drawn, usually three views of a drawing give enough information to make a three-dimensional object.

An architectural drawing or architect's drawing is a technical drawing of a building that falls within the definition of architecture. Architectural drawings are used by architects and others for a number of purposes: to develop a design idea into a coherent proposal, to communicate ideas and concepts, to convince clients of the merits of a design, to assist a building contractor to construct it based on design intent, as a record of the design and planned development, or to make a record of a building that already exists.

 Small kitchen in perspective
 Conventional line illustration of an engine demonstrating perspective and line techniques.
 Illustration of a drum set.
 Gallotia simonyi, example of pen and ink scientific illustration
 Broken view plan, showing the decks of a ship, drawn 1783


