Tide tables, sometimes called tide charts, are used for tidal prediction and show the daily times and levels of high and low tides, usually for a particular location.[1] Tide heights at intermediate times (between high and low water) can be approximated by using the rule of twelfths or more accurately calculated by using a published tidal curve for the location. Tide levels are typically given relative to a low-water vertical datum, e.g. the mean lower low water (MLLW) datum in the US.[2]
Tide tables are published in various forms, such as paper-based tables and tables available on the Internet. Most tide tables are calculated and published only for major ports, called "standard ports", and only for one year — standard ports can be relatively close together or hundreds of kilometers apart. The tide times for a minor port are estimated by the tide-table user manually calculating using the published time and height differences between a standard port and the minor port.
Dates and times
The dates of spring tides and neap tides, approximately seven days apart, can be determined by the heights of the tides on the classic tide tables: a small range indicates neaps and large indicates springs. This cycle of tides is linked to the phases of the moon, with the highest tides (spring tides) occurring near full moon and new moon.
However, successive (semidiurnal) tides are linked to the Moon's orbital period, thus they are approximately 24/27.3 hours later each day or about 50 minutes but many other observations and considerations are required to develop accurate tide tables. On the Atlantic coast of northwest Europe, the interval between each low and high tide averages about 6 hours and 10 minutes, giving two high tides and two low tides each day, with the highest tides about 2 days after full moon.
Calculation
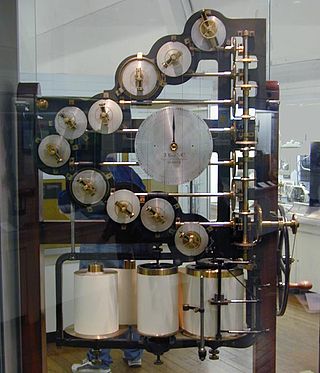
Tide prediction was long beset by the problem of laborious calculations. Before the use of digital computers tide tables were often generated by the use of a special-purpose calculating machine, the tide-predicting machine.
Tide times in art
Tidal Word Wave artwork by Adrian Riley and Rachel Welford
Time and Tide Bell is an art project made up of bells, designed by sculptor Marcus Vergette, installed at coastal locations in the UK. Each bell rings at high tide, and rising sea levels caused by global warming will change the sounds made by the bells.
Tidal Word Wave is an architectural glass artwork created by Rachel Welford and Adrian Riley in Bridlington, East Yorkshire. Found text from the immediate environment is arranged in overlapping patterns arranged according to tide times for that location.
Tides are the rise and fall of sea levels caused by the combined effects of the gravitational forces exerted by the Moon and are also caused by the Earth and Moon orbiting one another.
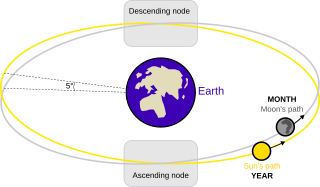
A lunar node is either of the two orbital nodes of the Moon, that is, the two points at which the orbit of the Moon intersects the ecliptic. The ascending node is where the Moon moves into the northern ecliptic hemisphere, while the descending node is where the Moon enters the southern ecliptic hemisphere.
A storm surge, storm flood, tidal surge, or storm tide is a coastal flood or tsunami-like phenomenon of rising water commonly associated with low-pressure weather systems, such as cyclones. It is measured as the rise in water level above the normal tidal level, and does not include waves.
The lunitidal interval measures the time lag from lunar culmination to the next high tide at a given location. It is also called the high water interval (HWI). Sometimes a term is not used for the time lag, but instead the terms age or establishment of the tide are used for the entry that is in tide tables.
A tide gauge is a device for measuring the change in sea level relative to a vertical datum. It is also known as a mareograph, marigraph, and sea-level recorder When applied to freshwater continental water bodies, the instrument may also be called a limnimeter.
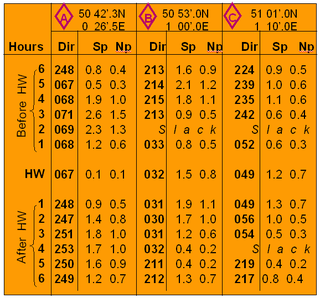
Tidal diamonds are symbols on British admiralty charts and others that indicate the direction and speed of tidal streams.
A chart datum is the water level surface serving as origin of depths displayed on a nautical chart and for reporting and predicting tide heights. A chart datum is generally derived from some tidal phase, in which case it is also known as a tidal datum. Common chart datums are lowest astronomical tide (LAT) and mean lower low water (MLLW). In non-tidal areas, e.g. the Baltic Sea, mean sea level (MSL) is used. A chart datum is a type of vertical datum and must not be confused with the horizontal datum for the chart.
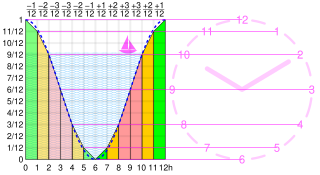
The rule of twelfths is an approximation to a sine curve. It can be used as a rule of thumb for estimating a changing quantity where both the quantity and the steps are easily divisible by 12. Typical uses are predicting the height of the tide or the change in day length over the seasons.
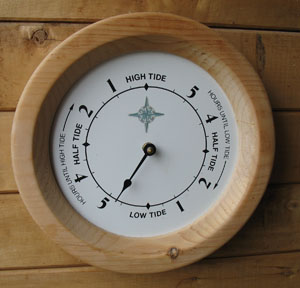
A tide clock is a specially designed clock that keeps track of the Moon's apparent motion around the Earth. Along many coastlines, the Moon contributes the major part (67%) of the combined lunar and solar tides. The exact interval between tides is influenced by the position of the Moon and Sun relative to the Earth, as well as the specific location on Earth where the tide is being measured. Due to the Moon's orbital prograde motion, it takes a particular point on the Earth 24 hours and 50.5 minutes to rotate under the Moon, so the time between high lunar tides fluctuates between 12 and 13 hours. A tide clock is divided into two roughly 6 hour tidal periods that shows the average length of time between high and low tides in a semi-diurnal tide region, such as most areas of the Atlantic Ocean.
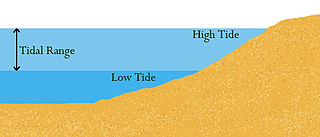
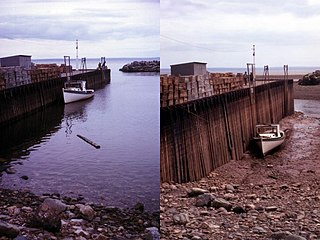
Tidal range is the difference in height between high tide and low tide. Tides are the rise and fall of sea levels caused by gravitational forces exerted by the Moon and Sun, by Earth's rotation and by centrifugal force caused by Earth's progression around the Earth-Moon barycenter. Tidal range depends on time and location.
The former Proudman Oceanographic Laboratory (POL) is based in Brownlow Street, Liverpool, England. In April 2010, POL merged with the National Oceanography Centre, Southampton (NOCS) to form the National Oceanography Centre. The Liverpool laboratory's scientific research focuses on oceanography encompassing global sea-levels and geodesy, numerical modelling of continental shelf seas and coastal sediment processes. This research alongside activities of surveying, monitoring, data management and forecasting provides strategic support for the wider mission of the Natural Environment Research Council.
A perigean spring tide is a tide that occurs three or four times per year when a perigee coincides with a spring tide. This has a slight but measurable impact on the spring tide, usually adding no more than a couple of inches.
The theory of tides is the application of continuum mechanics to interpret and predict the tidal deformations of planetary and satellite bodies and their atmospheres and oceans under the gravitational loading of another astronomical body or bodies.
A king tide is an especially high spring tide, especially the perigean spring tides which occur three or four times a year. King tide is not a scientific term, nor is it used in a scientific context.
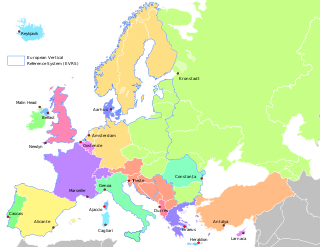
In geodesy, surveying, hydrography and navigation, vertical datum or altimetric datum, is a reference coordinate surface used for vertical positions, such as the elevations of Earth-bound features and altitudes of satellite orbits and in aviation. In planetary science, vertical datums are also known as zero-elevation surface or zero-level reference.
New Zealand has large ocean energy resources but does not yet generate any power from them. TVNZ reported in 2007 that over 20 wave and tidal power projects are currently under development. However, not a lot of public information is available about these projects. The Aotearoa Wave and Tidal Energy Association was established in 2006 to "promote the uptake of marine energy in New Zealand". According to their 10 February 2008 newsletter, they have 59 members. However, the association doesn't list its members.
A tide-predicting machine was a special-purpose mechanical analog computer of the late 19th and early 20th centuries, constructed and set up to predict the ebb and flow of sea tides and the irregular variations in their heights – which change in mixtures of rhythms, that never repeat themselves exactly. Its purpose was to shorten the laborious and error-prone computations of tide-prediction. Such machines usually provided predictions valid from hour to hour and day to day for a year or more ahead.
A tidal atlas or a tidal stream atlas is used to predict the direction and speed of tidal currents.
A supermoon is a full moon or a new moon that nearly coincides with perigee—the closest that the Moon comes to the Earth in its elliptic orbit—resulting in a slightly larger-than-usual apparent size of the Moon as viewed from Earth. The technical name is a perigee syzygy or a fullMoon around perigee. Because the term supermoon is astrological in origin, it has no precise astronomical definition.
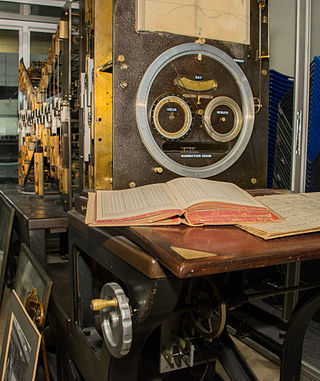
Tide-Predicting Machine No. 2, also known as Old Brass Brains, was a special-purpose mechanical computer that uses gears, pulleys, chains, and other mechanical components to compute the height and time of high and low tides for specific locations. The machine can perform tide calculations much faster than a person could do with pencil and paper. The United States Coast and Geodetic Survey put the machine into operation in 1910. It was used until 1965, when it was replaced by an electronic computer.
This page is based on this Wikipedia article Text is available under the CC BY-SA 4.0 license; additional terms may apply. Images, videos and audio are available under their respective licenses.