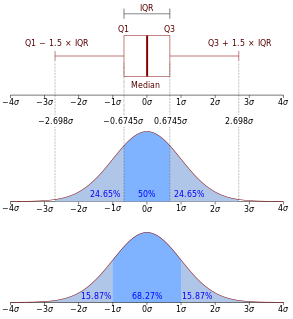
In probability theory and statistics, the cumulative distribution function (CDF) of a real-valued random variable , or just distribution function of , evaluated at , is the probability that will take a value less than or equal to .
In probability theory, the expected value of a random variable , denoted or , is a generalization of the weighted average, and is intuitively the arithmetic mean of a large number of independent realizations of . The expected value is also known as the expectation, mathematical expectation, mean, average, or first moment. Expected value is a key concept in economics, finance, and many other subjects.

In mathematics, the Dirac delta function is a generalized function or distribution, a function on the space of test functions. It was introduced by physicist Paul Dirac. It is called a function, although it is not a function R → C.
In probability theory, the central limit theorem (CLT) establishes that, in many situations, when independent random variables are added, their properly normalized sum tends toward a normal distribution even if the original variables themselves are not normally distributed. The theorem is a key concept in probability theory because it implies that probabilistic and statistical methods that work for normal distributions can be applicable to many problems involving other types of distributions. This theorem has seen many changes during the formal development of probability theory. Previous versions of the theorem date back to 1811, but in its modern general form, this fundamental result in probability theory was precisely stated as late as 1920, thereby serving as a bridge between classical and modern probability theory.

In probability theory, a probability density function (PDF), or density of a continuous random variable, is a function whose value at any given sample in the sample space can be interpreted as providing a relative likelihood that the value of the random variable would equal that sample. In other words, while the absolute likelihood for a continuous random variable to take on any particular value is 0, the value of the PDF at two different samples can be used to infer, in any particular draw of the random variable, how much more likely it is that the random variable would equal one sample compared to the other sample.

In calculus, Taylor's theorem gives an approximation of a k-times differentiable function around a given point by a polynomial of degree k, called the kth-order Taylor polynomial. For a smooth function, the Taylor polynomial is the truncation at the order k of the Taylor series of the function. The first-order Taylor polynomial is the linear approximation of the function, and the second-order Taylor polynomial is often referred to as the quadratic approximation. There are several versions of Taylor's theorem, some giving explicit estimates of the approximation error of the function by its Taylor polynomial.
Distributions, also known as Schwartz distributions or generalized functions, are objects that generalize the classical notion of functions in mathematical analysis. Distributions make it possible to differentiate functions whose derivatives do not exist in the classical sense. In particular, any locally integrable function has a distributional derivative. Distributions are widely used in the theory of partial differential equations, where it may be easier to establish the existence of distributional solutions than classical solutions, or appropriate classical solutions may not exist. Distributions are also important in physics and engineering where many problems naturally lead to differential equations whose solutions or initial conditions are distributions, such as the Dirac delta function.

In mathematics, the Wiener process is a real valued continuous-time stochastic process named in honor of American mathematician Norbert Wiener for his investigations on the mathematical properties of the one-dimensional Brownian motion. It is often also called Brownian motion due to its historical connection with the physical process of the same name originally observed by Scottish botanist Robert Brown. It is one of the best known Lévy processes and occurs frequently in pure and applied mathematics, economics, quantitative finance, evolutionary biology, and physics.

The power spectrum of a time series describes the distribution of power into frequency components composing that signal. According to Fourier analysis, any physical signal can be decomposed into a number of discrete frequencies, or a spectrum of frequencies over a continuous range. The statistical average of a certain signal or sort of signal as analyzed in terms of its frequency content, is called its spectrum.
In mathematics, the Cauchy principal value, named after Augustin Louis Cauchy, is a method for assigning values to certain improper integrals which would otherwise be undefined.
In numerical analysis and computational statistics, rejection sampling is a basic technique used to generate observations from a distribution. It is also commonly called the acceptance-rejection method or "accept-reject algorithm" and is a type of exact simulation method. The method works for any distribution in with a density.
In probability theory and statistics, the marginal distribution of a subset of a collection of random variables is the probability distribution of the variables contained in the subset. It gives the probabilities of various values of the variables in the subset without reference to the values of the other variables. This contrasts with a conditional distribution, which gives the probabilities contingent upon the values of the other variables.
In mathematical analysis, asymptotic analysis, also known as asymptotics, is a method of describing limiting behavior.
In mathematics, Laplace's method, named after Pierre-Simon Laplace, is a technique used to approximate integrals of the form
Renewal theory is the branch of probability theory that generalizes the Poisson process for arbitrary holding times. Instead of exponentially distributed holding times, a renewal process may have any independent and identically distributed (IID) holding times that have finite mean. A renewal-reward process additionally has a random sequence of rewards incurred at each holding time, which are IID but need not be independent of the holding times.

In probability theory and statistics, the characteristic function of any real-valued random variable completely defines its probability distribution. If a random variable admits a probability density function, then the characteristic function is the Fourier transform of the probability density function. Thus it provides an alternative route to analytical results compared with working directly with probability density functions or cumulative distribution functions. There are particularly simple results for the characteristic functions of distributions defined by the weighted sums of random variables.
Differential entropy is a concept in information theory that began as an attempt by Shannon to extend the idea of (Shannon) entropy, a measure of average surprisal of a random variable, to continuous probability distributions. Unfortunately, Shannon did not derive this formula, and rather just assumed it was the correct continuous analogue of discrete entropy, but it is not. The actual continuous version of discrete entropy is the limiting density of discrete points (LDDP). Differential entropy is commonly encountered in the literature, but it is a limiting case of the LDDP, and one that loses its fundamental association with discrete entropy.
In information theory, information dimension is an information measure for random vectors in Euclidean space, based on the normalized entropy of finely quantized versions of the random vectors. This concept was first introduced by Alfréd Rényi in 1959.
A ratio distribution is a probability distribution constructed as the distribution of the ratio of random variables having two other known distributions. Given two random variables X and Y, the distribution of the random variable Z that is formed as the ratio Z = X/Y is a ratio distribution.
Beliefs depend on the available information. This idea is formalized in probability theory by conditioning. Conditional probabilities, conditional expectations, and conditional probability distributions are treated on three levels: discrete probabilities, probability density functions, and measure theory. Conditioning leads to a non-random result if the condition is completely specified; otherwise, if the condition is left random, the result of conditioning is also random.


