Structured Query Language (SQL), is a domain-specific language used in programming and designed for managing data held in a relational database management system (RDBMS), or for stream processing in a relational data stream management system (RDSMS). It is particularly useful in handling structured data, i.e., data incorporating relations among entities and variables.

Data mining is the process of extracting and discovering patterns in large data sets involving methods at the intersection of machine learning, statistics, and database systems. Data mining is an interdisciplinary subfield of computer science and statistics with an overall goal of extracting information from a data set and transforming the information into a comprehensible structure for further use. Data mining is the analysis step of the "knowledge discovery in databases" process, or KDD. Aside from the raw analysis step, it also involves database and data management aspects, data pre-processing, model and inference considerations, interestingness metrics, complexity considerations, post-processing of discovered structures, visualization, and online updating.

Esri is an American multinational geographic information system (GIS) software company. It is best known for its ArcGIS products. With a 40% market share, Esri is the world's leading supplier of GIS software, web GIS and geodatabase management applications.

Social network analysis (SNA) is the process of investigating social structures through the use of networks and graph theory. It characterizes networked structures in terms of nodes and the ties, edges, or links that connect them. Examples of social structures commonly visualized through social network analysis include social media networks, meme spread, information circulation, friendship and acquaintance networks, peer learner networks, business networks, knowledge networks, difficult working relationships, collaboration graphs, kinship, disease transmission, and sexual relationships. These networks are often visualized through sociograms in which nodes are represented as points and ties are represented as lines. These visualizations provide a means of qualitatively assessing networks by varying the visual representation of their nodes and edges to reflect attributes of interest.
ADO.NET is a data access technology from the Microsoft .NET Framework that provides communication between relational and non-relational systems through a common set of components. ADO.NET is a set of computer software components that programmers can use to access data and data services from a database. It is a part of the base class library that is included with the Microsoft .NET Framework. It is commonly used by programmers to access and modify data stored in relational database systems, though it can also access data in non-relational data sources. ADO.NET is sometimes considered an evolution of ActiveX Data Objects (ADO) technology, but was changed so extensively that it can be considered an entirely new product.
A GIS software program is a computer program to support the use of a geographic information system, providing the ability to create, store, manage, query, analyze, and visualize geographic data, that is, data representing phenomena for which location is important. The GIS software industry encompasses a broad range of commercial and open-source products that provide some or all of these capabilities within various information technology architectures.

Data and information visualization is the practice of designing and creating easy-to-communicate and easy-to-understand graphic or visual representations of a large amount of complex quantitative and qualitative data and information with the help of static, dynamic or interactive visual items. Typically based on data and information collected from a certain domain of expertise, these visualizations are intended for a broader audience to help them visually explore and discover, quickly understand, interpret and gain important insights into otherwise difficult-to-identify structures, relationships, correlations, local and global patterns, trends, variations, constancy, clusters, outliers and unusual groupings within data. When intended for the general public to convey a concise version of known, specific information in a clear and engaging manner, it is typically called information graphics.
Neural network software is used to simulate, research, develop, and apply artificial neural networks, software concepts adapted from biological neural networks, and in some cases, a wider array of adaptive systems such as artificial intelligence and machine learning.

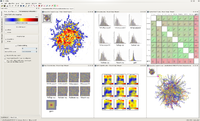
Waikato Environment for Knowledge Analysis (Weka) is a collection of machine learning and data analysis free software licensed under the GNU General Public License. It was developed at the University of Waikato, New Zealand and is the companion software to the book "Data Mining: Practical Machine Learning Tools and Techniques".
Object-oriented design (OOD) is the process of planning a system of interacting objects for the purpose of solving a software problem. It is one approach to software design.
Sociomapping is a method developed for processing and visualization of relational data. It is most commonly used for mapping the social structure within small teams. Sociomapping uses the landscape metaphor to display complex multi-dimensional data in a 3D map, where individual objects are localized in such way that their distance on the map corresponds to their distance in the underlying data.
Entity Framework (EF) is an open source object–relational mapping (ORM) framework for ADO.NET. It was originally shipped as an integral part of .NET Framework, however starting with Entity Framework version 6.0 it has been delivered separately from the .NET Framework.
Jock D. Mackinlay is an American information visualization expert and Vice President of Research and Design at Tableau Software. With Stuart Card, George G. Robertson and others he invented a number of information visualization techniques.
KNIME, the Konstanz Information Miner, is a free and open-source data analytics, reporting and integration platform. KNIME integrates various components for machine learning and data mining through its modular data pipelining "Building Blocks of Analytics" concept. A graphical user interface and use of JDBC allows assembly of nodes blending different data sources, including preprocessing, for modeling, data analysis and visualization without, or with only minimal, programming.
InfoZoom software is a data analysis, business intelligence and data visualization software product created using in-memory analytics. The software is created and supported by humanIT and the Fraunhofer Institute FIT, the same organization that created MP3 compression technology. The software has over 100,000 licensed users and over 1000 customers worldwide.

Apache Drill is an open-source software framework that supports data-intensive distributed applications for interactive analysis of large-scale datasets. Built chiefly by contributions from developers from MapR, Drill is inspired by Google's Dremel system. Drill is an Apache top-level project. Tom Shiran is the founder of the Apache Drill Project. It was designated an Apache Software Foundation top-level project in December 2016.

GPlates is open-source application software offering a novel combination of interactive plate-tectonic reconstructions, geographic information system (GIS) functionality and raster data visualisation.