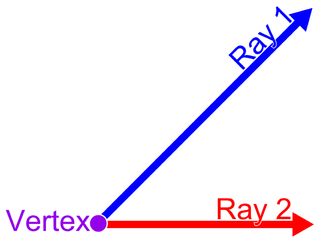
In plane geometry, an angle is the figure formed by two rays, called the sides of the angle, sharing a common endpoint, called the vertex of the angle. Angles formed by two rays lie in a plane, but this plane does not have to be a Euclidean plane. Angles are also formed by the intersection of two planes in Euclidean and other spaces. These are called dihedral angles. Angles formed by the intersection of two curves in a plane are defined as the angle determined by the tangent rays at the point of intersection. Similar statements hold in space, for example, the spherical angle formed by two great circles on a sphere is the dihedral angle between the planes determined by the great circles.
In statistics, a central tendency is a central or typical value for a probability distribution. It may also be called a center or location of the distribution. Colloquially, measures of central tendency are often called averages. The term central tendency dates from the late 1920s.

The derivative of a function of a real variable measures the sensitivity to change of the function value with respect to a change in its argument. Derivatives are a fundamental tool of calculus. For example, the derivative of the position of a moving object with respect to time is the object's velocity: this measures how quickly the position of the object changes when time advances.
In physics, power is the amount of energy transferred or converted per unit time. In the International System of Units, the unit of power is the watt, equal to one joule per second. In older works, power is sometimes called activity. Power is a scalar quantity.
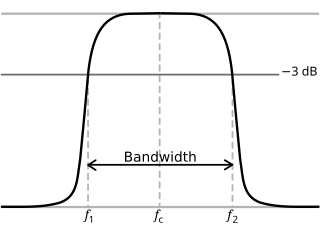
In physics and electrical engineering, a cutoff frequency, corner frequency, or break frequency is a boundary in a system's frequency response at which energy flowing through the system begins to be reduced rather than passing through.
The thermal conductivity of a material is a measure of its ability to conduct heat. It is commonly denoted by , , or .
The average absolute deviation, or mean absolute deviation (MAD), of a data set is the average of the absolute deviations from a central point. It is a summary statistic of statistical dispersion or variability. In the general form, the central point can be a mean, median, mode, or the result of any other measure of central tendency or any random data point related to the given data set. The absolute values of the differences between the data points and their central tendency are totaled and divided by the number of data points.

In thermodynamics and solid state physics, the Debye model is a method developed by Peter Debye in 1912 for estimating the phonon contribution to the specific heat in a solid. It treats the vibrations of the atomic lattice (heat) as phonons in a box, in contrast to the Einstein model, which treats the solid as many individual, non-interacting quantum harmonic oscillators. The Debye model correctly predicts the low temperature dependence of the heat capacity, which is proportional to – the Debye T3 law. Just like the Einstein model, it also recovers the Dulong–Petit law at high temperatures. But due to simplifying assumptions, its accuracy suffers at intermediate temperatures.

In mathematics, the total variation identifies several slightly different concepts, related to the structure of the codomain of a function or a measure. For a real-valued continuous function f, defined on an interval [a, b] ⊂ ℝ, its total variation on the interval of definition is a measure of the one-dimensional arclength of the curve with parametric equation x ↦ f(x), for x ∈ [a, b].
In statistics, the correlation ratio is a measure of the relationship between the statistical dispersion within individual categories and the dispersion across the whole population or sample. The measure is defined as the ratio of two standard deviations representing these types of variation. The context here is the same as that of the intraclass correlation coefficient, whose value is the square of the correlation ratio.
In statistics, a contingency table is a type of table in a matrix format that displays the (multivariate) frequency distribution of the variables. They are heavily used in survey research, business intelligence, engineering and scientific research. They provide a basic picture of the interrelation between two variables and can help find interactions between them. The term contingency table was first used by Karl Pearson in "On the Theory of Contingency and Its Relation to Association and Normal Correlation", part of the Drapers' Company Research Memoirs Biometric Series I published in 1904.
In probability theory and statistics, the coefficient of variation (CV), also known as relative standard deviation (RSD), is a standardized measure of dispersion of a probability distribution or frequency distribution. It is often expressed as a percentage, and is defined as the ratio of the standard deviation to the mean . The CV or RSD is widely used in analytical chemistry to express the precision and repeatability of an assay. It is also commonly used in fields such as engineering or physics when doing quality assurance studies and ANOVA gauge R&R. In addition, CV is utilized by economists and investors in economic models.
Virtual work arises in the application of the principle of least action to the study of forces and movement of a mechanical system. The work of a force acting on a particle as it moves along a displacement is different for different displacements. Among all the possible displacements that a particle may follow, called virtual displacements, one will minimize the action. This displacement is therefore the displacement followed by the particle according to the principle of least action. The work of a force on a particle along a virtual displacement is known as the virtual work.
Fairness measures or metrics are used in network engineering to determine whether users or applications are receiving a fair share of system resources. There are several mathematical and conceptual definitions of fairness.
The Lexis ratio is used in statistics as a measure which seeks to evaluate differences between the statistical properties of random mechanisms where the outcome is two-valued — for example "success" or "failure", "win" or "lose". The idea is that the probability of success might vary between different sets of trials in different situations. This ratio is not much used currently having been largely replaced by the use of the chi-squared test in testing for the homogeneity of samples.
An index of qualitative variation (IQV) is a measure of statistical dispersion in nominal distributions. There are a variety of these, but they have been relatively little-studied in the statistics literature. The simplest is the variation ratio, while more complex indices include the information entropy.
In probability theory and statistics, the index of dispersion, dispersion index,coefficient of dispersion,relative variance, or variance-to-mean ratio (VMR), like the coefficient of variation, is a normalized measure of the dispersion of a probability distribution: it is a measure used to quantify whether a set of observed occurrences are clustered or dispersed compared to a standard statistical model.
Krippendorff's alpha coefficient, named after academic Klaus Krippendorff, is a statistical measure of the agreement achieved when coding a set of units of analysis in terms of the values of a variable. Since the 1970s, alpha is used in content analysis where textual units are categorized by trained readers, in counseling and survey research where experts code open-ended interview data into analyzable terms, in psychological testing where alternative tests of the same phenomena need to be compared, or in observational studies where unstructured happenings are recorded for subsequent analysis.
The empty lattice approximation is a theoretical electronic band structure model in which the potential is periodic and weak. One may also consider an empty irregular lattice, in which the potential is not even periodic. The empty lattice approximation describes a number of properties of energy dispersion relations of non-interacting free electrons that move through a crystal lattice. The energy of the electrons in the "empty lattice" is the same as the energy of free electrons. The model is useful because it clearly illustrates a number of the sometimes very complex features of energy dispersion relations in solids which are fundamental to all electronic band structures.
Ordinal data is a categorical, statistical data type where the variables have natural, ordered categories and the distances between the categories is not known. These data exist on an ordinal scale, one of four levels of measurement described by S. S. Stevens in 1946. The ordinal scale is distinguished from the nominal scale by having a ranking. It also differs from interval and ratio scales by not having category widths that represent equal increments of the underlying attribute.


