The United Kingdom is a constitutional monarchy where executive power is delegated by legislation and social conventions to a unitary parliamentary democracy. From this a hereditary monarch, currently King Charles III, serves as head of state while the Prime Minister of the United Kingdom, currently Rishi Sunak since 2022, serves as the elected head of government.

The 1983 United Kingdom general election was held on Thursday 9 June 1983. It gave the Conservative Party under the leadership of Margaret Thatcher the most decisive election victory since that of the Labour Party in 1945, with a majority of 144 seats and the first of two consecutive landslide victories.
The 1987 United Kingdom general election was held on Thursday 11 June 1987, to elect 650 members to the House of Commons. The election was the third consecutive general election victory for the Conservative Party, who won a majority of 102 seats and second landslide under the leadership of Margaret Thatcher, who became the first Prime Minister since the Earl of Liverpool in 1820 to lead a party into three successive electoral victories.
The SDP–Liberal Alliance was a centrist and social liberal political and electoral alliance in the United Kingdom.

The 2005 United Kingdom general election was held on Thursday 5 May 2005, to elect 646 members to the House of Commons. The governing Labour Party, led by Tony Blair, won its third consecutive victory, with Blair becoming the second Labour leader after Harold Wilson to form three majority governments. However, its majority fell to 66 seats; the majority it won four years earlier had been of 167 seats. This would be the last election not won by the Conservative Party as of 2024. This was the first time the Labour Party had won a third consecutive election, and as of the 2024 general election remains the party's most recent general election victory.

The Liberal Democrats are a liberal political party in the United Kingdom, founded in 1988. They have been the third-largest UK political party by the number of votes cast since the 1992 general election, with the exception of the 2015 general election. They have 15 members of Parliament in the House of Commons, 84 members of the House of Lords, four Members of the Scottish Parliament and one member in the Welsh Senedd. The party has over 3000 local council seats, the third largest of the British political parties. The party holds a twice-per-year Liberal Democrat Conference, at which party policy is formulated. In contrast to its main opponents' conference rules, the Lib Dems grant all members attending its Conference the right to speak in debates and vote on party policy, under a one member, one vote system. The party also allows its members to vote online for its policies and in the election of a new leader. The party served as the junior party in a coalition government with the Conservative Party between 2010 and 2015; with Scottish Labour in the Scottish Executive from 1999 to 2007; and with Welsh Labour in the Welsh Government from 2000 to 2003 and from 2016 to 2021.
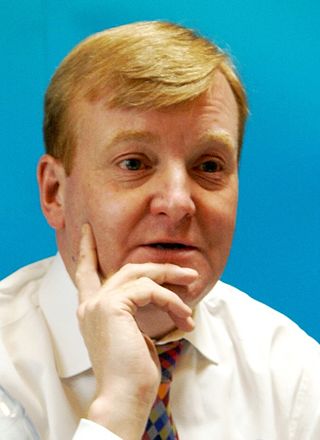
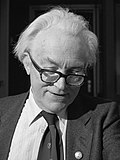
Charles Peter Kennedy was a British politician who served as Leader of the Liberal Democrats from 1999 to 2006, and was the Member of Parliament (MP) for Ross, Skye and Lochaber from 1983 to 2015.

The 2014 European Parliament election was the United Kingdom's component of the 2014 European Parliament election, held on Thursday 22 May 2014, coinciding with the 2014 local elections in England and Northern Ireland. In total, 73 Members of the European Parliament were elected from the United Kingdom using proportional representation. England, Scotland and Wales use a closed-list party list system of PR, while Northern Ireland used the single transferable vote (STV).

The Social Democratic Party (SDP) was a centrist to centre-left political party in the United Kingdom. The party supported a mixed economy, electoral reform, European integration and a decentralised state while rejecting the possibility of trade unions being overly influential within the industrial sphere. The SDP officially advocated social democracy, but its actual propensity is evaluated as close to social liberalism.

The 2015 United Kingdom general election in England was held on Thursday, 7 May 2015 for 533 English seats to the House of Commons. The Conservatives won a majority of seats in England for the second time since 1992.

The 2019 United Kingdom general election was held on Thursday 12 December 2019 with 47,074,800 registered voters entitled to vote to elect members of the House of Commons. The Conservative Party won a landslide victory with a majority of 80 seats, a net gain of 48, on 43.6% of the popular vote, the highest percentage for any party since the 1979 general election, though with a narrower popular vote margin than that achieved by Labour over the Conservatives in 1997.
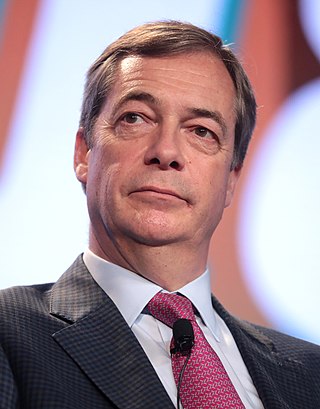
The 2019 European Parliament election was the United Kingdom's component of the 2019 European Parliament election. It was held on Thursday 23 May 2019 and the results announced on Sunday 26 and Monday 27 May 2019, after all the other EU countries had voted. This was the United Kingdom's final participation in a European Parliament election before leaving the European Union on 31 January 2020, and was also the last election to be held under the provisions of the European Parliamentary Elections Act 2002 before its repeal under the European Union (Withdrawal) Act 2018.
The region of North East England is divided into 29 parliamentary constituencies which is made up of 19 borough constituencies and 10 county constituencies. Since the 2019 general election, 17 are represented by Labour MPs and 11 by Conservative MPs. One is an independent.
The region of East Midlands is divided into 46 parliamentary constituencies which is made up of 12 borough constituencies and 34 county constituencies. Since the 2019 United Kingdom general election, 35 are represented by Conservative MPs, 8 by Labour MPs, 2 by independent MPs, and 1 by a Reform UK MP.
The region of Yorkshire and the Humber is divided into 54 parliamentary constituencies which is made up of 25 borough constituencies and 29 county constituencies. Since the general election of December 2019, 24 are represented by Conservative MPs and 30 by Labour MPs.
The region of the East of England is divided into 58 parliamentary constituencies which is made up of 16 borough constituencies and 42 county constituencies. Since the general election of December 2019, 50 are represented by Conservative MPs, seven by Labour MPs, and one by a Liberal Democrat MP.
The region of West Midlands is divided into 59 parliamentary constituencies which is made up of 35 borough constituencies and 24 county constituencies. Since the general election of December 2019, 41 are represented by Conservative MPs, 16 by Labour MPs, 1 by a Liberal Democrat MP, and 1 by an independent MP.
The region of North West England is divided into 75 parliamentary constituencies, of which 39 are borough constituencies and 36 are county constituencies. Since the general election of December 2019, 30 are represented by Conservative MPs, 41 by Labour MPs, 1 by a Liberal Democrat MP, 1 by the Speaker, and 1 by a Workers MP.
The region of South East England is divided into 84 parliamentary constituencies, which are made up of 23 borough constituencies and 61 county constituencies. Since the general election of December 2019, 72 are represented by Conservative MPs, 9 by Labour MPs, 2 by Liberal Democrat MPs, and 1 by a Green MP.

A general election was held in the United Kingdom on Thursday 9 June 1983 and all 72 seats in Scotland were contested.