Frequency response curves used in sound pressure level measurement
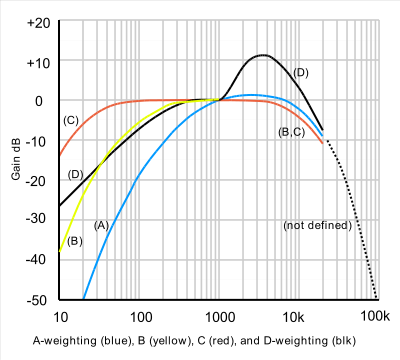
A graph of the A-, B-, C- and D-weightings across the frequency range 10Hz–20kHzVideo illustrating A-weighting by analyzing a sine sweep (contains audio)
A-weighting is the most commonly used of a family of curves defined in the International standard IEC 61672:2003 and various national standards relating to the measurement of sound pressure level.[1] A-weighting is applied to instrument-measured sound levels in an effort to account for the relative loudness perceived by the human ear, as the ear is less sensitive to low audio frequencies. It is employed by arithmetically adding a table of values, listed by octave or third-octave bands, to the measured sound pressure levels in dB. The resulting octave band measurements are usually added (logarithmic method) to provide a single A-weighted value describing the sound; the units are written as dB(A). Other weighting sets of values – B, C, D and now Z – are discussed below.
The curves were originally defined for use at different average sound levels, but A-weighting, though originally intended only for the measurement of low-level sounds (around 40 phon), is now commonly used for the measurement of environmental noise and industrial noise, as well as when assessing potential hearing damage and other noise health effects at all sound levels; indeed, the use of A-frequency-weighting is now mandated for all these measurements, because decades of field experience have shown a very good correlation with occupational deafness in the frequency range of human speech. It is also used when measuring low-level noise in audio equipment, especially in the United States.[not verified in body] In Britain, Europe and many other parts of the world, broadcasters and audio engineers[who?] more often use the ITU-R 468 noise weighting, which was developed in the 1960s based on research by the BBC and other organizations. This research showed that our ears respond differently to random noise, and the equal-loudness curves on which the A, B and C weightings were based are really only valid for pure single tones.[not verified in body]
History
A-weighting began with work by Fletcher and Munson which resulted in their publication, in 1933, of a set of equal-loudness contours. Three years later these curves were used in the first American standard for sound level meters.[2] This ANSI standard, later revised as ANSI S1.4-1981, incorporated B-weighting as well as the A-weighting curve, recognising the unsuitability of the latter for anything other than low-level measurements. But B-weighting has since fallen into disuse. Later work, first by Zwicker and then by Schomer, attempted to overcome the difficulty posed by different levels, and work by the BBC resulted in the CCIR-468 weighting, currently maintained as ITU-R 468 noise weighting, which gives more representative readings on noise as opposed to pure tones.[citation needed]
Deficiencies
A-weighting is valid to represent the sensitivity of the human ear as a function of the frequency of pure tones. The A-weighting was based on the 40-phon Fletcher–Munson curves, which represented an early determination of the equal-loudness contour for human hearing. However, because decades of field experience have shown a very good correlation between the A scale and occupational deafness in the frequency range of human speech,[citation needed] this scale is employed in many jurisdictions to evaluate the risks of occupational deafness and other auditory problems related to signals or speech intelligibility in noisy environments.
Because of perceived discrepancies between early and more recent determinations, the International Organization for Standardization (ISO) revised its standard curves as defined in ISO 226, in response to the recommendations of a study coordinated by the Research Institute of Electrical Communication, Tohoku University, Japan. The study produced new curves by combining the results of several studies, by researchers in Japan, Germany, Denmark, UK, and USA. (Japan was the greatest contributor with about 40% of the data.) This has resulted in the recent acceptance of a new set of curves standardized as ISO 226:2003. The report comments on the surprisingly large differences, and the fact that the original Fletcher–Munson contours are in better agreement with recent results than the Robinson-Dadson, which appear to differ by as much as 10–15dB especially in the low-frequency region, for reasons that are not explained. The report also shows that the 40-phon Fletcher-Munson contour is in better agreement with the updated 60-phon contour incorporated into ISO 226:2003, which challenges the common assertion that A-weighting represents loudness only for quiet sounds.[3]
Nevertheless, A-weighting would be a better match to the loudness curve if it fell much more steeply above 10kHz, and it is likely that this compromise came about because steep filters were difficult to construct in the early days of electronics.[citation needed] Nowadays, no such limitation need exist, as demonstrated by the ITU-R 468 curve. If A-weighting is used without further band-limiting it is possible to obtain different readings on different instruments when ultrasonic, or near ultrasonic noise is present. Accurate measurements therefore require a 20kHz low-pass filter to be combined with the A-weighting curve in modern instruments. This is defined in IEC 61012 as AU weighting and while very desirable, is rarely fitted to commercial sound level meters.
B-, C-, D-, G- and Z-weightings
A-frequency-weighting is mandated by the international standard IEC61672 to be fitted to all sound level meters and are approximations to the equal loudness contours given in ISO226.[4] The old B- and D-frequency-weightings have fallen into disuse, but many sound level meters provide for C frequency-weighting and its fitting is mandated — at least for testing purposes — to precision (Class one) sound level meters. D-frequency-weighting was specifically designed for use when measuring high-level aircraft noise in accordance with the IEC 537 measurement standard. The large peak in the D-weighting curve is not a feature of the equal-loudness contours, but reflects the fact that humans hear random noise differently from pure tones, an effect that is particularly pronounced around 6kHz. This is because individual neurons from different regions of the cochlea in the inner ear respond to narrow bands of frequencies, but the higher frequency neurons integrate a wider band and hence signal a louder sound when presented with noise containing many frequencies than for a single pure tone of the same pressure level.[citation needed]
Following changes to the ISO standard, D-frequency-weighting by itself should now only be used for non-bypass-type jet engines, which are found only on military aircraft and not on commercial aircraft. For this reason, today A-frequency-weighting is now mandated for light civilian aircraft measurements, while a more accurate loudness-corrected weighting EPNdB is required for certification of large transport aircraft.[5] D-weighting is the basis for the measurement underlying EPNdB.
Z- or ZERO frequency-weighting was introduced in the International Standard IEC61672 in 2003 and was intended to replace the "Flat" or "Linear" frequency weighting often fitted by manufacturers. This change was needed as each sound level meter manufacturer could choose their own low and high frequency cut-offs (–3dB) points, resulting in different readings, especially when peak sound level was being measured[citation needed]. It is a flat frequency response between 10Hz and 20kHz ±1.5dB.[6][failed verification] As well, the C-frequency-weighting, with –3dB points at 31.5Hz and 8kHz did not have a sufficient bandpass to allow the sensibly correct measurement of true peak noise (Lpk).
G-weighting is used for measurements in the infrasound range from 8Hz to about 40Hz.[7]
B- and D-frequency-weightings are no longer described in the body of the standard IEC61672:2003, but their frequency responses can be found in the older IEC60651, although that has been formally withdrawn by the International Electrotechnical Commission in favour of IEC61672:2003. The frequency weighting tolerances in IEC61672 have been tightened over those in the earlier standards IEC179 and IEC60651 and thus instruments complying with the earlier specifications should no longer be used for legally required measurements.
Environmental and other noise measurements
Label related to a portable air compressor
A-weighted decibels are abbreviated dB(A) or dBA. When acoustic (calibrated microphone) measurements are being referred to, then the units used will be dBSPL referenced to 20 micropascals = 0dB SPL.[nb 1]
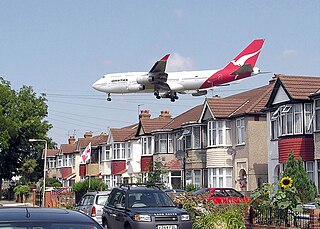
The A-weighting curve has been widely adopted for environmental noise measurement, and is standard in many sound level meters. The A-weighting system is used in any measurement of environmental noise (examples of which include roadway noise, rail noise, aircraft noise). A-weighting is also in common use for assessing potential hearing damage caused by loud noise, including noise dose measurements at work. A noise level of more than 85dB(A) each day increases the risk factor for hearing damage.
A-weighted sound power levelsLWA are increasingly found on sales literature for domestic appliances such as refrigerators, freezers and computer fans. The expected sound pressure level to be measured at a given distance as SPL with a sound level meter can with some simplifications be calculated from the sound power level. In Europe, the A-weighted noise level is used for instance for normalizing the noise of tires on cars.
Noise exposure for visitors of venues with loud music is usually also expressed in dB(A), although the presence of high levels of low frequency noise does not justify this.
Audio reproduction and broadcasting equipment
Although the A-weighting curve, in widespread use for noise measurement, is said to have been based on the 40-phon Fletcher-Munson curve, research in the 1960s demonstrated that determinations of equal-loudness made using pure tones are not directly relevant to our perception of noise.[8] This is because the cochlea in our inner ear analyses sounds in terms of spectral content, each hair cell responding to a narrow band of frequencies known as a critical band.[citation needed] The high-frequency bands are wider in absolute terms than the low-frequency bands, and therefore 'collect' proportionately more power from a noise source.[citation needed] However, when more than one critical band is stimulated, the outputs of the various bands are summed by the brain to produce an impression of loudness. For these reasons equal-loudness curves derived using noise bands show an upwards tilt above 1kHz and a downward tilt below 1kHz when compared to the curves derived using pure tones.
This enhanced sensitivity to noise in the region of 6kHz became particularly apparent in the late 1960s with the introduction of compact cassette recorders and Dolby-B noise reduction. A-weighted noise measurements were found to give misleading results because they did not give sufficient prominence to the 6kHz region where the noise reduction was having greatest effect, and did not sufficiently attenuate noise around 10kHz and above (a particular example is with the 19kHz pilot tone on FM radio systems which, though usually inaudible is not sufficiently attenuated by A-weighting, so that sometimes one piece of equipment would even measure worse than another and yet sound better, because of differing spectral content.
ITU-R 468 noise weighting was therefore developed to more accurately reflect the subjective loudness of all types of noise, as opposed to tones. This curve, which came out of work done by the BBC Research Department, and was standardised by the CCIR and later adopted by many other standards bodies (IEC, BSI) and, as of 2006[update], is maintained by the ITU. It became widely used in Europe, especially in broadcasting, and was adopted by Dolby Laboratories who realised its superior validity for their purposes when measuring noise on film soundtracks and compact cassette systems. Its advantages over A-weighting are less accepted in the US, where the use of A-weighting still predominates.[citation needed] It is used by broadcasters in Britain, Europe, and former countries of the British Empire such as Australia and South Africa.
Function realisation of some common weightings
The standard[9] defines weightings () in dB units by tables with tolerance limits (to allow a variety of implementations). Additionally, the standard describes weighting functions [9] to calculate the weightings. The weighting function is applied to the amplitude spectrum (not the intensity spectrum) of the unweighted sound level. The offsets ensure the normalisation to 0dB at 1000Hz. Appropriate weighting functions are:[10]
The gain curves can be realised[12] by the following s-domain transfer functions. They are not defined in this way though, being defined by tables of values with tolerances in the standards documents, thus allowing different realisations:[citation needed]
A
kA ≈ 7.39705 × 10⁹
B
kB ≈ 5.99185 × 10⁹
C
kC ≈ 5.91797 × 10⁹
D
kD ≈ 91104.32
The k-values are constants that are used to normalize the function to a gain of 1 (0dB). The values listed above normalize the functions to 0dB at 1kHz, as they are typically used. (This normalization is shown in the image.)
↑ dBrn adjusted is not a synonym for dB(A), but for dBa. (In telecommunications dBa denotes "decibels adjusted", i.e. weighted absolute noise power, which has nothing to do with A-weighting.)
Related Research Articles
The decibel is a relative unit of measurement equal to one tenth of a bel (B). It expresses the ratio of two values of a power or root-power quantity on a logarithmic scale. Two signals whose levels differ by one decibel have a power ratio of 101/10 or root-power ratio of 101/20.
A weighting filter is used to emphasize or suppress some aspects of a phenomenon compared to others, for measurement or other purposes.
The total harmonic distortion is a measurement of the harmonic distortion present in a signal and is defined as the ratio of the sum of the powers of all harmonic components to the power of the fundamental frequency. Distortion factor, a closely related term, is sometimes used as a synonym.
The mel scale is a perceptual scale of pitches judged by listeners to be equal in distance from one another. The reference point between this scale and normal frequency measurement is defined by assigning a perceptual pitch of 1000 mels to a 1000 Hz tone, 40 dB above the listener's threshold. Above about 500 Hz, increasingly large intervals are judged by listeners to produce equal pitch increments.
Noise pollution, or sound pollution, is the propagation of noise or sound with ranging impacts on the activity of human or animal life, most of which are harmful to a degree. The source of outdoor noise worldwide is mainly caused by machines, transport and propagation systems. Poor urban planning may give rise to noise disintegration or pollution, side-by-side industrial and residential buildings can result in noise pollution in the residential areas. Some of the main sources of noise in residential areas include loud music, transportation, lawn care maintenance, construction, electrical generators, wind turbines, explosions and people.
In information theory, the Shannon–Hartley theorem tells the maximum rate at which information can be transmitted over a communications channel of a specified bandwidth in the presence of noise. It is an application of the noisy-channel coding theorem to the archetypal case of a continuous-time analog communications channel subject to Gaussian noise. The theorem establishes Shannon's channel capacity for such a communication link, a bound on the maximum amount of error-free information per time unit that can be transmitted with a specified bandwidth in the presence of the noise interference, assuming that the signal power is bounded, and that the Gaussian noise process is characterized by a known power or power spectral density. The law is named after Claude Shannon and Ralph Hartley.
The sone is a unit of loudness, the subjective perception of sound pressure. The study of perceived loudness is included in the topic of psychoacoustics and employs methods of psychophysics. Doubling the perceived loudness doubles the sone value. Proposed by Stanley Smith Stevens in 1936, it is not an SI unit.
Audio system measurements are a means of quantifying system performance. These measurements are made for several purposes. Designers take measurements so that they can specify the performance of a piece of equipment. Maintenance engineers make them to ensure equipment is still working to specification, or to ensure that the cumulative defects of an audio path are within limits considered acceptable. Audio system measurements often accommodate psychoacoustic principles to measure the system in a way that relates to human hearing.
In acoustics, loudness is the subjective perception of sound pressure. More formally, it is defined as the "attribute of auditory sensation in terms of which sounds can be ordered on a scale extending from quiet to loud". The relation of physical attributes of sound to perceived loudness consists of physical, physiological and psychological components. The study of apparent loudness is included in the topic of psychoacoustics and employs methods of psychophysics.
Sound pressure or acoustic pressure is the local pressure deviation from the ambient atmospheric pressure, caused by a sound wave. In air, sound pressure can be measured using a microphone, and in water with a hydrophone. The SI unit of sound pressure is the pascal (Pa).
Sound intensity, also known as acoustic intensity, is defined as the power carried by sound waves per unit area in a direction perpendicular to that area. The SI unit of intensity, which includes sound intensity, is the watt per square meter (W/m2). One application is the noise measurement of sound intensity in the air at a listener's location as a sound energy quantity.
An equal-loudness contour is a measure of sound pressure level, over the frequency spectrum, for which a listener perceives a constant loudness when presented with pure steady tones. The unit of measurement for loudness levels is the phon and is arrived at by reference to equal-loudness contours. By definition, two sine waves of differing frequencies are said to have equal-loudness level measured in phons if they are perceived as equally loud by the average young person without significant hearing impairment.
A weighting curve is a graph of a set of factors, that are used to 'weight' measured values of a variable according to their importance in relation to some outcome. An important example is frequency weighting in sound level measurement where a specific set of weighting curves known as A-, B-, C-, and D-weighting as defined in IEC 61672 are used. Unweighted measurements of sound pressure do not correspond to perceived loudness because the human ear is less sensitive at low and high frequencies, with the effect more pronounced at lower sound levels. The four curves are applied to the measured sound level, for example by the use of a weighting filter in a sound level meter, to arrive at readings of loudness in phons or in decibels (dB) above the threshold of hearing.
An audiogram is a graph that shows the audible threshold for standardized frequencies as measured by an audiometer. The Y axis represents intensity measured in decibels (dB) and the X axis represents frequency measured in hertz (Hz). The threshold of hearing is plotted relative to a standardised curve that represents 'normal' hearing, in dB(HL). They are not the same as equal-loudness contours, which are a set of curves representing equal loudness at different levels, as well as at the threshold of hearing, in absolute terms measured in dB SPL.
ITU-R 468 is a standard relating to noise measurement, widely used when measuring noise in audio systems. The standard, now referred to as ITU-R BS.468-4, defines a weighting filter curve, together with a quasi-peak rectifier having special characteristics as defined by specified tone-burst tests. It is currently maintained by the International Telecommunication Union who took it over from the CCIR.
The process of weighting involves emphasizing the contribution of particular aspects of a phenomenon over others to an outcome or result; thereby highlighting those aspects in comparison to others in the analysis. That is, rather than each variable in the data set contributing equally to the final result, some of the data is adjusted to make a greater contribution than others. This is analogous to the practice of adding (extra) weight to one side of a pair of scales in order to favour either the buyer or seller.
A sound level meter is used for acoustic measurements. It is commonly a hand-held instrument with a microphone. The best type of microphone for sound level meters is the condenser microphone, which combines precision with stability and reliability. The diaphragm of the microphone responds to changes in air pressure caused by sound waves. That is why the instrument is sometimes referred to as a sound pressure level meter (SPL). This movement of the diaphragm, i.e. the sound pressure, is converted into an electrical signal. While describing sound in terms of sound pressure, a logarithmic conversion is usually applied and the sound pressure level is stated instead, in decibels (dB), with 0 dB SPL equal to 20 micropascals.
Measurement of wow and flutter is carried out on audio tape machines, cassette recorders and players, and other analog recording and reproduction devices with rotary components This measurement quantifies the amount of 'frequency wobble' present in subjectively valid terms. Turntables tend to suffer mainly slow wow. In digital systems, which are locked to crystal oscillators, variations in clock timing are referred to as wander or jitter, depending on speed.
Audio noise measurement is a process carried out to assess the quality of audio equipment, such as the kind used in recording studios, broadcast engineering, and in-home high fidelity.
In physics, sound is a vibration that propagates as an acoustic wave through a transmission medium such as a gas, liquid or solid. In human physiology and psychology, sound is the reception of such waves and their perception by the brain. Only acoustic waves that have frequencies lying between about 20 Hz and 20 kHz, the audio frequency range, elicit an auditory percept in humans. In air at atmospheric pressure, these represent sound waves with wavelengths of 17 meters (56 ft) to 1.7 centimeters (0.67 in). Sound waves above 20 kHz are known as ultrasound and are not audible to humans. Sound waves below 20 Hz are known as infrasound. Different animal species have varying hearing ranges.
↑ Ratzel, U.; Bayer, O.; Brachat, P.; Hoffmann, M.; Jänke, K.; Kiesel, K.-J.; Mehnert, C.; Scheck, C.; Westerhausen, C.; Krapf, K.-G.; Herrmann, L.; Blaul, J., eds. (February 2020) [2016-02-26]. "Tieffrequente Geräusche inkl. Infraschall von Windkraftanlagen und anderen Quellen - Bericht über Ergebnisse des Messprojekts 2013-2015" (in German) (3ed.). Karlsruhe, Germany: Landesanstalt für Umwelt, Messungen und Naturschutz Baden-Württemberg (LUBW), Referat 34 – Technischer Arbeitsschutz, Lärmschutz. pp.10–11, 13, 17, 22–24, 27–28, 32–33, 38–39, 43–44, 49, 90. Retrieved 2021-06-07. p.90: Für den Bereich des Infraschalls gibt es eine eigene Frequenzbewertung, die so genannte G-Bewertung. Entsprechend bewertete Pegel werden als dB(G) – „Dezibel G" – angegeben. Bekannter ist die A-Bewertung von Geräuschen als dB(A) – „Dezibel A" –, die dem Hörempfinden des Menschen nachempfunden ist. Die G-Bewertung hat ihren Schwerpunkt bei 20Hz. Zwischen 10Hz und 25Hz werden Pegel verstärkt, darunter und darüber fällt die Bewertungskurve rasch ab. Zweck der G-Bewertung ist es, eine Situation im Hinblick auf tiefe Frequenzen bzw. Infraschall mit einer einzigen Zahl zu charakterisieren. Ein Nachteil ist, dass Frequenzen unterhalb 8Hz und oberhalb 40Hz kaum mehr einen Beitrag leisten. (104 pages)
↑ Bauer, B.; Torick, E. (1966). "Researches in loudness measurement". IEEE Transactions on Audio and Electroacoustics. 14 (3): 141–151. doi:10.1109/TAU.1966.1161864.
This page is based on this Wikipedia article Text is available under the CC BY-SA 4.0 license; additional terms may apply. Images, videos and audio are available under their respective licenses.