Buffett indicator

Last updated
.mw-parser-output .legend{page-break-inside:avoid;break-inside:avoid-column}.mw-parser-output .legend-color{display:inline-block;min-width:1.25em;height:1.25em;line-height:1.25;margin:1px 0;text-align:center;border:1px solid black;background-color:transparent;color:black}.mw-parser-output .legend-text{}
Wilshire 5000 to GDP ratio Wilshire 5000 to GDP ratio.webp
   Wilshire 5000 to GDP ratio

The Buffett indicator (or the Buffett metric, or the Market capitalization-to-GDP ratio) [1] is a valuation multiple used to assess how expensive or cheap the aggregate stock market is at a given point in time. [1] [2] It was proposed as a metric by investor Warren Buffett in 2001, who called it "probably the best single measure of where valuations stand at any given moment", and its modern form compares the capitalization of the US Wilshire 5000 index to US GDP. [lower-alpha 1] [5] [3] It is widely followed by the financial media as a valuation measure for the US market in both its absolute, [6] [3] [5] and de-trended forms. [7] [4]

Contents

The indicator set an all-time high during the so-called "everything bubble", crossing the 200% level in February 2021; [6] [4] a level that Buffett warned if crossed, was "playing with fire". [8] [3]

History

On 10 December 2001, Buffett proposed the metric in a Fortune essay co-authored with journalist Carol Loomis. [8] In the essay, Buffett presented a chart going back 80 years that showed the value of all "publicly traded securities" in the US as a percentage of "US GNP". [8] Buffett said of the metric: "Still, it is probably the best single measure of where valuations stand at any given moment. And as you can see, nearly two years ago the ratio rose to an unprecedented level. That should have been a very strong warning signal". [8]

Buffett explained that for the annual return of US securities to materially exceed the annual growth of US GNP for a protracted period of time: "you need to have the line go straight off the top of the chart. That won't happen". [8] Buffett finished the essay by outlining the levels he believed the metric showed favorable or poor times to invest: "For me, the message of that chart is this: If the percentage relationship falls to the 70% or 80% area, buying stocks is likely to work very well for you. If the ratio approaches 200%–as it did in 1999 and a part of 2000–you are playing with fire". [8] [3]

Buffett's metric became known as the "Buffett Indicator", and has continued to receive widespread attention in the financial media, [6] [1] [9] [10] and in modern finance textbooks. [11] [12] [13]

In 2018, finance author Mark Hulbert writing in the Wall Street Journal , listed the Buffett indicator as one of his "Eight Best Predictors of the Long-Term Market". [2]

A study by two European academics published in May, 2022 found the Buffett Indicator "explains a large fraction of ten-year return variation for the majority of countries outside the United States". [14] The study examined 10-year periods in fourteen developed markets, in most cases with data starting in 1973. The Buffett Indicator forecasted an average of 83% of returns across all nations and periods, though the predictive value ranged from a low of 42% to as high as 93% depending on the specific nation. Accuracy was lower in nations with smaller stock markets.

Theory

Buffett acknowledged that his metric was a simple one and thus had "limitations", however the underlying theoretical basis for the indicator, particularly in the US, is considered reasonable. [8] [2]

For example, studies have shown a consistent and strong annual correlation between US GDP growth, and US corporate profit growth, [15] and which has increased materially since the Great Recession of 2007–2009. [16] GDP captures effects where a given industry's margins increase materially for a period, but the effect of reduced wages and costs, dampening margins in other industries. [15]

The same studies show a poor annual correlation between US GDP growth and US equity returns, underlining Buffett's belief that when equity prices get ahead of corporate profits (via the GNP/GDP proxy), poor returns will follow. [15] The indicator has also been advocated for its ability to reduce the effects of "aggressive accounting" or "adjusted profits", that distort the value of corporate profits in the price–earnings ratio or EV/EBITDA ratio metrics; and that it is not affected by share buybacks (which don't affect aggregate corporate profits). [17]

The Buffett indicator has been calculated for most international stock markets, however, caveats apply as other markets can have less stable compositions of listed corporations (e.g. the Saudi Arabia metric was materially impacted by the 2018 listing of Aramco), or a significantly higher/lower composition of private vs public firms (e.g. Germany vs. Switzerland), and therefore comparisons across international markets using the indicator as a comparative measure of valuation are not appropriate. [18]

The Buffett indicator has also been calculated for industries (but also noting that it is not relevant for cross industry valuation comparison). [13]

There is evidence that the Buffett indicator has trended upwards over time, particularly post 1995, and the lows registered in 2009 would have registered as average readings from the 1950–1995 era. [7] Reasons proposed include that GDP might not capture all the overseas profits of US multinationals (e.g. use of tax havens or tax structures by large US technology and life sciences multinationals), or that the profitability of US companies has structurally increased (e.g. due to increased concentration of technology companies), thus justifying a higher ratio; although that may also revert over time. [1] [19] Other commentators have highlighted that the omission by metric of corporate debt, could also be having an effect. [4]

Formula

Buffett's original chart used US GNP as the divisor, which captures the domestic and international activity of all US resident entities even if based abroad, however, many modern Buffett metrics use US GDP as the metric. [17] US GDP has historically been within 1 percent of US GNP, and is more readily available (other international markets have greater variation between GNP and GDP). [20] [7]

Buffett's original chart used the Federal Reserve Economic Data (FRED) database from the Federal Reserve Bank of St. Louis for "corporate equities", [lower-alpha 2] as it went back for over 80 years; however, many modern Buffett metrics simply use the main S&P 500 index, [3] or the broader Wilshire 5000 index instead. [17] [19]

A common modern formula for the US market, which is expressed as a percentage, is: [19] [4]

(E.g. if US GDP is USD 20 trillion and the market capitalization of the Wilshire 5000 is USD 40 trillion, then the Buffett indicator for the US is 200%; i.e. US public companies are twice as big as annual US economic output.)

The choice of how GDP is calculated (e.g. deflator), can materially affect the absolute value of the ratio; [18] for example, the Buffett indicator calculated by the Federal Reserve Bank of St. Louis peaks at 118% in Q1 2000, [21] while the version calculated by Wilshire Associates peaks at 137% in Q1 2000, [22] while the versions following Buffett's original technique, peak at very close to 160% in Q1 2000. [7] [4]

Records

Using Buffett's original calculation basis in his 2001 article, but with GDP, the metric has had the following lows and highs from 1950 to February 2021: [7]

Using the more common modern Buffett indicator with the Wilshire 5000 and US GDP, the metric has had the following lows and highs from 1970 to February 2021: [7]

De-trended data of Buffett's original calculation basis (see above) has had the following lows and highs from 1950 to February 2021 (expressed a % deviation from mean): [7]

See also

Notes

  1. Note that slightly different Buffett indicators can be calculated when using the S&P 500 index, or using different definitions of GDP, and even using GNP (Buffett's original divisor). [3] [4]
  2. Or more technically, item NCBEILQ027S, from Line 62 in the F.103 balance sheet of Table S.5.q of the "Integrated Macroeconomic Accounts for the United States" (Market Value of Equities Outstanding) file. [7]

Related Research Articles

Fundamental analysis, in accounting and finance, is the analysis of a business's financial statements ; health; and competitors and markets. It also considers the overall state of the economy and factors including interest rates, production, earnings, employment, GDP, housing, manufacturing and management. There are two basic approaches that can be used: bottom up analysis and top down analysis. These terms are used to distinguish such analysis from other types of investment analysis, such as quantitative and technical.

<span class="mw-page-title-main">Market capitalization</span> Total value of a public companys outstanding shares

Market capitalization, sometimes referred to as market cap, is the total value of a publicly traded company's outstanding common shares owned by stockholders.

Investment is traditionally defined as the "commitment of resources to achieve later benefits". If an investment involves money, then it can be defined as a "commitment of money to receive more money later". From a broader viewpoint, an investment can be defined as "to tailor the pattern of expenditure and receipt of resources to optimise the desirable patterns of these flows". When expenditures and receipts are defined in terms of money, then the net monetary receipt in a time period is termed cash flow, while money received in a series of several time periods is termed cash flow stream.

<span class="mw-page-title-main">Price–earnings ratio</span> Financial Metric

The price–earnings ratio, also known as P/E ratio, P/E, or PER, is the ratio of a company's share (stock) price to the company's earnings per share. The ratio is used for valuing companies and to find out whether they are overvalued or undervalued.

Stock valuation is the method of calculating theoretical values of companies and their stocks. The main use of these methods is to predict future market prices, or more generally, potential market prices, and thus to profit from price movement – stocks that are judged undervalued are bought, while stocks that are judged overvalued are sold, in the expectation that undervalued stocks will overall rise in value, while overvalued stocks will generally decrease in value. A target price is a price at which an analyst believes a stock to be fairly valued relative to its projected and historical earnings.

Greed and fear refer to two opposing emotional states theorized as factors causing the unpredictability and volatility of the stock market, and irrational market behavior inconsistent with the efficient-market hypothesis. Greed and fear relate to an old Wall Street saying: "financial markets are driven by two powerful emotions – greed and fear."

Enterprise value (EV), total enterprise value (TEV), or firm value (FV) is an economic measure reflecting the market value of a business. It is a sum of claims by all claimants: creditors and shareholders. Enterprise value is one of the fundamental metrics used in business valuation, financial analysis, accounting, portfolio analysis, and risk analysis.

<span class="mw-page-title-main">Wilshire 5000</span> Stock market index

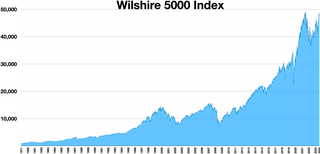
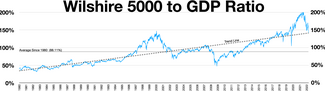
The Wilshire 5000 Total Market Index, or more simply the Wilshire 5000, is a market-capitalization-weighted index of the market value of all American stocks actively traded in the United States. As of September 30, 2023, the index contained 3,427 components. The index is intended to measure the performance of most publicly traded companies headquartered in the United States, with readily available price data. Hence, the index includes a majority of the common stocks and REITs traded primarily through New York Stock Exchange, NASDAQ, or the American Stock Exchange. Limited partnerships and ADRs are not included. It can be tracked by following the ticker ^W5000.

Contrarian investing is an investment strategy that is characterized by purchasing and selling in contrast to the prevailing sentiment of the time.

Price–sales ratio, P/S ratio, or PSR, is a valuation metric for stocks. It is calculated by dividing the company's market capitalization by the revenue in the most recent year; or, equivalently, divide the per-share stock price by the per-share revenue.

Alpha is a measure of the active return on an investment, the performance of that investment compared with a suitable market index. An alpha of 1% means the investment's return on investment over a selected period of time was 1% better than the market during that same period; a negative alpha means the investment underperformed the market. Alpha, along with beta, is one of two key coefficients in the capital asset pricing model used in modern portfolio theory and is closely related to other important quantities such as standard deviation, R-squared and the Sharpe ratio.

Capitalization rate is a real estate valuation measure used to compare different real estate investments.

An undervalued stock is defined as a stock that is selling at a price significantly below what is assumed to be its intrinsic value. For example, if a stock is selling for $50, but it is worth $100 based on predictable future cash flows, then it is an undervalued stock. The undervalued stock has the intrinsic value below the investment's true intrinsic value.

Stock market prediction is the act of trying to determine the future value of a company stock or other financial instrument traded on an exchange. The successful prediction of a stock's future price could yield significant profit. The efficient-market hypothesis suggests that stock prices reflect all currently available information and any price changes that are not based on newly revealed information thus are inherently unpredictable. Others disagree and those with this viewpoint possess myriad methods and technologies which purportedly allow them to gain future price information.

In finance, a Class B share or Class C share is a designation for a share class of a common or preferred stock that typically has strengthened voting rights or other benefits compared to a Class A share that may have been created. The equity structure, or how many types of shares are offered, is determined by the corporate charter.

Quality investing is an investment strategy based on a set of clearly defined fundamental criteria that seeks to identify companies with outstanding quality characteristics. The quality assessment is made based on soft and hard criteria. Quality investing supports best overall rather than best-in-class approach.

<span class="mw-page-title-main">Stock market index</span> Financial metric which investors use to determine market performance

In finance, a stock index, or stock market index, is an index that measures the performance of a stock market, or of a subset of a stock market. It helps investors compare current stock price levels with past prices to calculate market performance.

The price-to-book ratio, or P/B ratio, is a financial ratio used to compare a company's current market value to its book value. The calculation can be performed in two ways, but the result should be the same. In the first way, the company's market capitalization can be divided by the company's total book value from its balance sheet. The second way, using per-share values, is to divide the company's current share price by the book value per share. It is also known as the market-to-book ratio and the price-to-equity ratio, and its inverse is called the book-to-market ratio.

<span class="mw-page-title-main">Everything bubble</span> 2020–2021 correlated bubble in assets

The expression "everything bubble" refers to the correlated impact of monetary easing by the Federal Reserve on asset prices in most asset classes, namely equities, housing, bonds, many commodities, and even exotic assets such as cryptocurrencies and SPACs. The term is related to the Fed put, being the tools of direct and indirect quantitative easing that the Fed used to execute the monetary easing, and to modern monetary theory, which advocates the use of such tools, even in non-crisis periods, to create economic growth through asset price inflation. The term first came in use during the chair of Janet Yellen, but it is most associated with the subsequent chair of Jerome Powell, and the 2020–2021 period of the coronavirus pandemic.

The Economy monetization is a metric of the national economy, reflecting its saturation with liquid assets. The level of monetization is determined both by the development of the national financial system and by the whole economy. The monetization of economy also determines the freedom of capital movement. Long time ago scientists recognized the important role played by the money supply. Nevertheless, only approximately 50 years ago did Milton Friedman convincingly prove that change in the money quantity might have a very serious effect on the GDP. The monetization is especially important in low- to middle-income countries in which it is substantially correlated with the per-capita GDP and real interest rates. This fact suggests that supporting an upward monetization trend can be an important policy objective for governments.

References

  1. 1 2 3 4 Mohamed, Theron (10 February 2021). "Warren Buffett's favorite market indicator soars to record high, signaling stocks are overvalued and a crash may be coming". Business Insider . Retrieved 18 February 2021.
  2. 1 2 3 Hulbert, Mark (5 August 2018). "The Eight Best Predictors of the Long-Term Market". Wall Street Journal . Retrieved 21 February 2021.
  3. 1 2 3 4 5 6 Ponciano, Jonathan (12 February 2021). "Is The Stock Market About To Crash?". Forbes . Retrieved 14 February 2021.
  4. 1 2 3 4 5 6 "The Buffett Indicator". CurrentMarketValuation. 11 February 2021. Retrieved 18 February 2021.
  5. 1 2 Ang, Carmen (17 February 2021). "The Buffett Indicator at All-Time Highs: Is This Cause for Concern?". VisualCapitalist. Retrieved 18 February 2021.
  6. 1 2 3 Regan, Michael P.; Hajric, Vildana; Ballentine, Claire (12 February 2021). "Warren Buffett's Favorite Valuation Metric Is Ringing an Alarm". Bloomberg. Retrieved 13 February 2021.
  7. 1 2 3 4 5 6 7 8 Minski, Jill (4 February 2021). "Market Cap to GDP: An Updated Look at the Buffett Valuation Indicator". AdvisorPerspectives. Retrieved 18 February 2021.
  8. 1 2 3 4 5 6 7 Buffett, Warren; Loomis, Carol (10 December 2001). "Warren Buffett On The Stock Market". Fortune . Retrieved 18 February 2021. What's in the future for investors--another roaring bull market or more upset stomach? Amazingly, the answer may come down to three simple factors. Here, the world's most celebrated investor talks about what really makes the market tick--and whether that ticking should make you nervous.
  9. Scholer, Kristen (14 June 2015). "MoneyBeat: Buffett Indicator Flares". Wall Street Journal . Retrieved 18 February 2021.
  10. Max, Sarah (2 February 2021). "Future Returns: The Value Gap Is Too Big to Ignore". Barron's . Retrieved 18 February 2021.
  11. Cornell, Shaun; Cornell, Bradford; Cornell, Andrew (December 2018). The Conceptual Foundations of Investing: A Short Book of Need–to–Know Essentials (1st ed.). Wiley. ISBN   978-1119516293.
  12. Naito, Michiro (October 2019). Japanese Equities: A Practical Guide to Investing in the Nikkei (1st ed.). Wiley. ISBN   978-1119603665.
  13. 1 2 Sanz, Jorge L.C (2016). "Chapter 26: Understanding Buffett Indicators in Different Industries". Business Analytics. pp. 685–710. doi:10.1142/9789813149311_0026. ISBN   978-9813149304 . Retrieved 19 February 2021.
  14. Swinkels, Laurens and Umlauft, Thomas S., The Buffett Indicator: International Evidence (March 30, 2022). Available at SSRN: https://ssrn.com/abstract=4071039 or http://dx.doi.org/10.2139/ssrn.4071039
  15. 1 2 3 "Is There a Link Between GDP Growth and Equity Returns?". MSCI . May 2010. Retrieved 19 February 2021.
  16. Hansen, Steven (15 October 2015). "What Is the Relationship Between Corporate Profits and GDP?". NASDAQ. Retrieved 19 February 2021.
  17. 1 2 3 Tully, Shawn (19 June 2019). "One of Warren Buffett's Favorite Metrics Is Flashing Red—a Sign That Corporate Profits Are Due for a Hit". Fortune . Retrieved 18 February 2021.
  18. 1 2 Vohra, Navin (29 January 2021). "The Buffett Indicator Revisited: Market Cap-to-GDP and Valuations". CFA Institute . Retrieved 18 February 2021.
  19. 1 2 3 "Market Cap to GDP Ratio (the Buffett Indicator)". Corporate Finance Institute . 2021. Retrieved 18 February 2021.
  20. "US GDP vs. US GNP". St. Louis Federal Reserve. Retrieved 18 February 2021.
  21. "Wilshire 5000 Total Market Full Cap Index/Gross Domestic Product (GDP at 2007 prices)". Federal Reserve Bank of St. Louis . Retrieved 19 February 2021.
  22. Richer, Felix (9 February 2021). "Are We in a Stock Market Bubble?". Statista . Retrieved 19 February 2021.

Further reading