In finance, technical analysis is an analysis methodology for analysing and forecasting the direction of prices through the study of past market data, primarily price and volume. As a type of active management, it stands in contradiction to much of modern portfolio theory. The efficacy of technical analysis is disputed by the efficient-market hypothesis, which states that stock market prices are essentially unpredictable, and research on whether technical analysis offers any benefit has produced mixed results. It is distinguished from fundamental analysis, which considers a company's financial statements, health, and the overall state of the market and economy.
The relative strength index (RSI) is a technical indicator used in the analysis of financial markets. It is intended to chart the current and historical strength or weakness of a stock or market based on the closing prices of a recent trading period. The indicator should not be confused with relative strength.

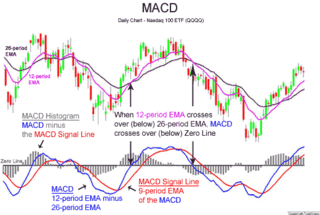
MACD, short for moving average convergence/divergence, is a trading indicator used in technical analysis of securities prices, created by Gerald Appel in the late 1970s. It is designed to reveal changes in the strength, direction, momentum, and duration of a trend in a stock's price.
The money flow index (MFI) is an oscillator that ranges from 0 to 100. It is used to show the money flow over several days.
Williams %R, or just %R, is a technical analysis oscillator showing the current closing price in relation to the high and low of the past N days. It was developed by a publisher and promoter of trading materials, Larry Williams. Its purpose is to tell whether a stock or commodity market is trading near the high or the low, or somewhere in between, of its recent trading range.

Keltner channel is a technical analysis indicator showing a central moving average line plus channel lines at a distance above and below. The indicator is named after Chester W. Keltner (1909–1998) who described it in his 1960 book How To Make Money in Commodities. This name was applied by those who heard about it from him, but Keltner called it the ten-day moving average trading rule and indeed made no claim to any originality for the idea.

The detrended price oscillator (DPO) is an indicator in technical analysis that attempts to eliminate the long-term trends in prices by using a displaced moving average so it does not react to the most current price action. This allows the indicator to show intermediate overbought and oversold levels effectively.
The Negative Volume Index and Positive Volume Index indicators are indicators to identify primary market trends and reversals.

The ultimate oscillator is a theoretical concept in finance developed by Larry Williams as a way to account for the problems experienced in most oscillators when used over different lengths of time.
Trend following or trend trading is a trading strategy according to which one should buy an asset when its price trend goes up, and sell when its trend goes down, expecting price movements to continue.
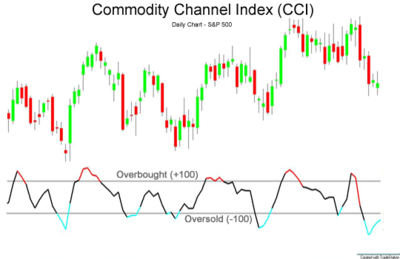
In technical analysis in finance, a technical indicator is a mathematical calculation based on historic price, volume, or open interest information that aims to forecast financial market direction. Technical indicators are a fundamental part of technical analysis and are typically plotted as a chart pattern to try to predict the market trend. Indicators generally overlay on price chart data to indicate where the price is going, or whether the price is in an "overbought" condition or an "oversold" condition. Among the most widely used and top indicators in the field are the Moving Average Convergence Divergence (MACD), Relative Strength Index (RSI), Bollinger Bands, Stochastic Oscillator, and Fibonacci Retracements, each providing unique insights into market trends, momentum, and potential reversal points.
In technical analysis of securities trading, the stochastic oscillator is a momentum indicator that uses support and resistance levels. George Lane developed this indicator in the late 1950s. The term stochastic refers to the point of a current price in relation to its price range over a period of time. This method attempts to predict price turning points by comparing the closing price of a security to its price range.
The McClellan oscillator is a market breadth indicator used in technical analysis by financial analysts of the New York Stock Exchange to evaluate the balance between the advancing and declining stocks. The McClellan oscillator is based on the Advance-Decline Data and it could be applied to stock market exchanges, indexes, portfolio of stocks or any basket of stocks.
An oscillator is a technical analysis indicator that varies over time within a band. Oscillators are used to discover short-term overbought or oversold conditions.
The Vortex Indicator is a technical indicator invented by Etienne Botes and Douglas Siepman to identify the start of a new trend or the continuation of an existing trend within financial markets. It was published in the January 2010 edition of Technical Analysis of Stocks & Commodities.
Relative currency strength (RCS) is the purchasing power of a currency when traded against other foreign currencies, or used to trade products. It is also a technical indicator used in the technical analysis of foreign exchange market (Forex). It is intended to chart the current and historical strength or weakness of a currency based on the closing prices of a recent trading period. It is based on the relative strength index and mathematical decorrelation of 28 cross currency pairs. It shows the relative strength momentum of the selected major currency. (EUR, GBP, AUD, USD, CAD, CHF, JPY)
In financial technical analysis, the know sure thing (KST) oscillator is a complex, smoothed price velocity indicator developed by Martin J. Pring.
The range expansion index (REI) is a technical indicator used in the technical analysis of financial markets. It is intended to chart the relative strength or weakness of a trading vehicle based on the comparison of the recent price changes and the overall price changes for the period.
The true strength index (TSI) is a technical indicator used in the analysis of financial markets that attempts to show both trend direction and overbought/oversold conditions. It was first published William Blau in 1991. The indicator uses moving averages of the underlying momentum of a financial instrument. Momentum is considered a leading indicator of price movements, and a moving average characteristically lags behind price. The TSI combines these characteristics to create an indication of price and direction more in sync with market turns than either momentum or moving average. The TSI is provided as part of the standard collection of indicators offered by various trading platforms.

Volume Analysis is an example of a type of technical analysis that examines the volume of traded securities to confirm and predict price trends. Volume is a measure of the number of shares of an asset that are traded in a given period of time. As one of the oldest market indicators used for analysis, sudden changes in volume are often the result of news-related events. Commonly used by chartists and technical analysts, volume analysis is centered on the following ideas:


