County result maps
 2009 results map
 2013 results map
 2017 results map
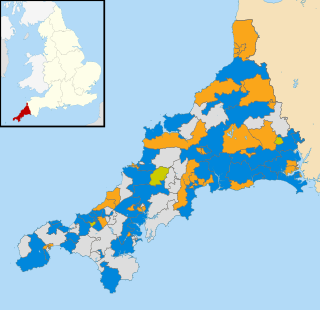
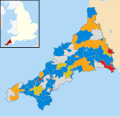 2021 results map
Cornwall Council in England, UK, was established in 2009 and is elected every four years. From 1973 to 2005 elections were for Cornwall County Council, with the first election for the new unitary Cornwall Council held in June 2009. This election saw 123 members elected, replacing the previous 82 councillors on Cornwall County Council and the 249 on the six district and borough councils (Caradon, Carrick, Kerrier, North Cornwall, Penwith, and Restormel). [1] In June 2013 the Local Government Boundary Commission for England announced a public consultation on its proposal that Cornwall Council should have 87 councillors in future. [2]
Control following each election since 1973:


| Party | Candidate | Votes | % | ±% | |
|---|---|---|---|---|---|
| Independent | 598 | 45.4 | +45.4 | ||
| Conservative | 366 | 27.8 | -1.2 | ||
| Liberal Democrats | 236 | 17.9 | -29.1 | ||
| Labour | 116 | 8.8 | -15.2 | ||
| Majority | 232 | 17.6 | |||
| Turnout | 1,316 | ||||
| Independent gain from Liberal Democrats | Swing | ||||
| Party | Candidate | Votes | % | ±% | |
|---|---|---|---|---|---|
| Conservative | 438 | 38.5 | +16.8 | ||
| Independent | 359 | 31.6 | -19.7 | ||
| Labour | 177 | 15.6 | +15.6 | ||
| Liberal Democrats | 163 | 14.3 | -12.7 | ||
| Majority | 79 | 6.9 | |||
| Turnout | 1,137 | 26.6 | |||
| Conservative gain from Independent | Swing | ||||
| Party | Candidate | Votes | % | ±% | |
|---|---|---|---|---|---|
| Liberal Democrats | 871 | 63.0 | |||
| Conservative | 351 | 25.3 | |||
| Mebyon Kernow | 161 | 11.5 | |||
| Majority | 520 | 37.7 | |||
| Turnout | 1,383 | 35.0 | |||
| Liberal Democrats gain from Independent | Swing | ||||
| Party | Candidate | Votes | % | ±% | |
|---|---|---|---|---|---|
| Conservative | 594 | 31.4 | +9.4 | ||
| Independent | 452 | 23.9 | +23.9 | ||
| Liberal Democrats | 435 | 23.0 | -37.0 | ||
| Independent | 413 | 21.8 | +21.8 | ||
| Majority | 142 | 7.5 | |||
| Turnout | 1,894 | 39.3 | |||
| Conservative gain from Liberal Democrats | Swing | ||||
| Party | Candidate | Votes | % | ±% | |
|---|---|---|---|---|---|
| Liberal Democrats | 824 | 50.6 | +12.0 | ||
| Conservative | 803 | 49.4 | +9.0 | ||
| Majority | 21 | 1.2 | |||
| Turnout | 1,627 | 37.0 | |||
| Liberal Democrats gain from Conservative | Swing | ||||
| Party | Candidate | Votes | % | ±% | |
|---|---|---|---|---|---|
| Independent | 767 | 58.5 | +58.5 | ||
| Liberal Democrats | 471 | 35.9 | -34.5 | ||
| Mebyon Kernow | 74 | 5.6 | -8.7 | ||
| Majority | 296 | 22.6 | |||
| Turnout | 1,312 | ||||
| Independent gain from Liberal Democrats | Swing | ||||
| Party | Candidate | Votes | % | ±% | |
|---|---|---|---|---|---|
| Liberal Democrats | 650 | 47.0 | -10.4 | ||
| Independent | 291 | 21.0 | +21.0 | ||
| Conservative | 237 | 17.1 | +2.6 | ||
| Labour | 153 | 11.1 | -17.0 | ||
| Mebyon Kernow | 52 | 3.8 | +3.8 | ||
| Majority | 359 | 26.0 | |||
| Turnout | 1,383 | 28.1 | |||
| Liberal Democrats hold | Swing | ||||
| Party | Candidate | Votes | % | ±% | |
|---|---|---|---|---|---|
| Independent | 432 | 36.9 | +36.9 | ||
| Liberal Democrats | 306 | 26.1 | -23.8 | ||
| Conservative | 248 | 21.2 | +2.2 | ||
| Labour | 186 | 15.9 | -11.8 | ||
| Majority | 126 | 10.8 | |||
| Turnout | 1,172 | 27.6 | |||
| Independent gain from Liberal Democrats | Swing | ||||
| Party | Candidate | Votes | % | ±% | |
|---|---|---|---|---|---|
| Independent | 429 | 39.5 | +12.4 | ||
| Liberal Democrats | 408 | 37.6 | -4.7 | ||
| Conservative | 203 | 18.7 | +18.7 | ||
| Mebyon Kernow | 46 | 4.2 | +4.2 | ||
| Majority | 21 | 1.9 | |||
| Turnout | 1,086 | 20.8 | |||
| Independent gain from Liberal Democrats | Swing | ||||
| Party | Candidate | Votes | % | ±% | |
|---|---|---|---|---|---|
| Liberal Democrats | 544 | 39.2 | +8.2 | ||
| Conservative | 533 | 38.4 | +38.4 | ||
| Independent | 201 | 14.5 | -12.8 | ||
| Independent | 53 | 3.8 | -15.7 | ||
| UKIP | 49 | 3.5 | +3.5 | ||
| Independent | 7 | 0.5 | +0.5 | ||
| Majority | 11 | 0.8 | |||
| Turnout | 1,387 | 26.2 | |||
| Liberal Democrats hold | Swing | ||||
| Party | Candidate | Votes | % | ±% | |
|---|---|---|---|---|---|
| Liberal Democrats | Terence Rowe | 792 | 40.5 | +12.9 | |
| Liberal | 785 | 40.1 | +12.5 | ||
| Independent | 234 | 12.0 | +12.0 | ||
| Labour | 145 | 7.4 | -15.3 | ||
| Majority | 7 | 0.4 | |||
| Turnout | 1,956 | 35.0 | |||
| Liberal Democrats gain from Liberal | Swing | ||||
| Party | Candidate | Votes | % | ±% | |
|---|---|---|---|---|---|
| Conservative | Armand Toms | 848 | 48.2 | +17.4 | |
| Liberal Democrats | Walter ThomasScarah | 716 | 40.7 | +11.8 | |
| Independent | Donald Webb | 165 | 9.4 | -30.9 | |
| Labour | Graham McGrath | 30 | 1.7 | +1.7 | |
| Majority | 132 | 7.5 | |||
| Turnout | 1,759 | 40.3 | |||
| Conservative gain from Independent | Swing | ||||
| Party | Candidate | Votes | % | ±% | |
|---|---|---|---|---|---|
| Independent | William Curnow | 512 | 75.5 | +13.0 | |
| Conservative | Fiona Kemp | 116 | 17.1 | +17.1 | |
| Independent | George Dyer | 50 | 7.4 | +7.4 | |
| Majority | 396 | 58.4 | |||
| Turnout | 678 | 17.1 | |||
| Independent hold | Swing | ||||
| Party | Candidate | Votes | % | ±% | |
|---|---|---|---|---|---|
| Labour | 298 | 29.7 | -12.0 | ||
| Independent | 227 | 22.6 | +22.6 | ||
| Conservative | 205 | 20.4 | -1.0 | ||
| Liberal Democrats | 176 | 17.5 | -0.9 | ||
| Independent | 68 | 6.8 | -4.8 | ||
| Mebyon Kernow | 16 | 1.6 | +1.6 | ||
| Liberal | 14 | 1.4 | -5.5 | ||
| Majority | 71 | 7.1 | |||
| Turnout | 1,004 | 21.0 | |||
| Labour hold | Swing | ||||
| Party | Candidate | Votes | % | ±% | |
|---|---|---|---|---|---|
| Liberal | Paul Holmes | 324 | 29.6 | +10.6 | |
| Liberal Democrats | David Ekinsmyth | 268 | 24.5 | +5.1 | |
| Independent | Thomas Bray | 216 | 19.7 | -3.3 | |
| Conservative | Mary Anson | 202 | 18.5 | +0.5 | |
| Labour | Anthony Bunt | 84 | 7.7 | -8.6 | |
| Majority | 56 | 5.1 | |||
| Turnout | 1,094 | 20.5 | |||
| Liberal gain from Independent | Swing | ||||
| Party | Candidate | Votes | % | ±% | |
|---|---|---|---|---|---|
| Liberal Democrats | Cait Hutchings | 456 | 38.6 | +4.3 | |
| Independent | Mary May | 360 | 30.5 | +8.6 | |
| Conservative | Gill Grant | 207 | 17.5 | +6.0 | |
| Labour | Charlotte MacKenzie | 94 | 8.0 | -12.7 | |
| Independent | Georgina Fryer | 63 | 5.3 | +5.3 | |
| Majority | 96 | 8.1 | |||
| Turnout | 1,180 | 24.0 | |||
| Liberal Democrats hold | Swing | ||||
| Party | Candidate | Votes | % | ±% | |
|---|---|---|---|---|---|
| Liberal Democrats | John Oxenham | 690 | 48.2 | +14.7 | |
| Conservative | Bob Davidson | 675 | 47.2 | -12.3 | |
| Labour | Margaret Pitches | 66 | 4.6 | -2.4 | |
| Majority | 15 | 1.0 | |||
| Turnout | 1,431 | 41.0 | |||
| Liberal Democrats gain from Conservative | Swing | ||||
| Party | Candidate | Votes | % | ±% | |
|---|---|---|---|---|---|
| Labour | Jude Robinson | 230 | 32.4 | +21.7 | |
| Conservative | Dennis Pascoe | 203 | 28.6 | -8.3 | |
| Liberal Democrats | Anna Pascoe | 152 | 21.4 | +2.0 | |
| Liberal | Paul Holmes | 61 | 8.6 | +6.4 | |
| Mebyon Kernow | Mike Champion | 32 | 4.5 | -10.2 | |
| Green | Jacqui Merrick | 31 | 4.4 | +4.4 | |
| Majority | 27 | 3.8 | |||
| Turnout | 709 | ||||
| Labour gain from Conservative | Swing | ||||
| Party | Candidate | Votes | % | ±% | |
|---|---|---|---|---|---|
| Liberal Democrats | David Parsons | 958 | 61.2 | -11.2 | |
| Conservative | Trevor Macey | 395 | 25.2 | -2.4 | |
| Labour | Adrian Jones | 120 | 7.7 | +7.7 | |
| Independent | Louise Emo | 93 | 5.9 | +5.9 | |
| Majority | 563 | 36.0 | |||
| Turnout | 1570 | 29.5 | |||
| Liberal Democrats hold | Swing | -4.4 | |||
| Party | Candidate | Votes | % | ±% | |
|---|---|---|---|---|---|
| Mebyon Kernow | Loveday Jenkin | 427 | 36.4 | +16.5 | |
| Liberal Democrats | John Martin | 262 | 22.3 | +12.3 | |
| Conservative | Linda Taylor | 227 | 19.4 | +3.8 | |
| Independent | Philip Martin | 177 | 15.1 | -16.6 | |
| Labour | Robert Webber | 80 | 6.8 | +3.8 | |
| Majority | 165 | 14.1 | |||
| Turnout | 1175 | 27.8 | |||
| Mebyon Kernow gain from Independent | Swing | +16.6 | |||
| Party | Candidate | Votes | % | ±% | |
|---|---|---|---|---|---|
| Conservative | Walter Sanger | 585 | 55.3 | +21.0 | |
| Liberal Democrats | Nicholas Driver | 279 | 26.4 | +19.8 | |
| UKIP | Sandy Martin | 141 | 13.3 | +13.3 | |
| Labour | Steven Richards | 52 | 4.9 | +3.2 | |
| Majority | 306 | 28.9 | +28.1 | ||
| Turnout | 1057 | 28.6 | -23.4 | ||
| Conservative gain from Independent | Swing | ||||
| Party | Candidate | Votes | % | ±% | |
|---|---|---|---|---|---|
| Liberal Democrats | Steve Knightley | 408 | 31.8 | +6.9 | |
| Independent | Tony Rush | 399 | 31.1 | N/A | |
| Conservative | Stephen Rushworth | 217 | 16.9 | +5.6 | |
| UKIP | Roderick Harrison | 202 | 15.7 | +0.1 | |
| Labour | Adrian Darrell Jones | 58 | 4.5 | -7.6 | |
| Majority | 9 | 0.7 | +0.5 | ||
| Turnout | 1285 | 40.5 | -1.8 | ||
| Liberal Democrats gain from Independent | Swing | +0.5 | |||
| Party | Candidate | Votes | % | ±% | |
|---|---|---|---|---|---|
| Liberal Democrats | David Raymond Ekinsmyth | 277 | 23.8 | +10.1 | |
| Mebyon Kernow | Stephen Richardson | 217 | 18.6 | -6.6 | |
| Conservative | Adam Desmonde | 215 | 18.5 | -10.3 | |
| UKIP | Clive Polkinghorne | 156 | 13.4 | -9.1 | |
| Labour | Trevor Chalker | 129 | 11.1 | +1.3 | |
| Liberal | Paul Holmes | 121 | 10.4 | N/A | |
| Green | Jacqueline Merrick | 50 | 4.3 | N/A | |
| Majority | 60 | 5.2 | +1.6 | ||
| Turnout | 1,165 | 32.4 | +2.0 | ||
| Liberal Democrats gain from Conservative | Swing | +10.2 | |||
| Party | Candidate | Votes | % | ±% | |
|---|---|---|---|---|---|
| Conservative | Peter Williams | 406 | 32.6 | +4.2 | |
| Liberal Democrats | John Ault | 405 | 32.5 | +9.6 | |
| UKIP | Peter Tisdale | 271 | 21.7 | -6.9 | |
| Labour | Linda Hitchcox | 107 | 8.6 | -0.3 | |
| Mebyon Kernow | Karen Sumser-Lupson | 58 | 4.7 | N/A | |
| Majority | 1 | 0.1 | -0.2 | ||
| Turnout | 1,247 | 28.5 | -11.2 | ||
| Conservative gain from UKIP | Swing | +5.6 | |||
| Party | Candidate | Votes | % | ±% | |
|---|---|---|---|---|---|
| Conservative | James Michael Mustoe | 348 | 32.2 | +8.2 | |
| UKIP | Michael Williams | 281 | 26.0 | -1.6 | |
| Labour | Charmain Nicholas | 204 | 18.9 | -10.8 | |
| Liberal Democrats | Christopher Maynard | 197 | 18.2 | +4.2 | |
| Green | Katherine Moseley | 50 | 4.6 | -0.1 | |
| Majority | 67 | 6.2 | +4.1 | ||
| Turnout | 1,080 | 32.5 | -8.0 | ||
| Conservative gain from Labour | Swing | +9.5 | |||
| Party | Candidate | Votes | % | ±% | |
|---|---|---|---|---|---|
| Conservative | John Bastin | 1,431 | 47.6 | –9.7 | |
| Liberal Democrats | Rowland Abram | 434 | 14.4 | N/A | |
| UKIP | Chris Kinder | 416 | 13.8 | –15.2 | |
| Labour | Adam Crickett | 384 | 12.8 | –0.8 | |
| Mebyon Kernow | Charlotte Evans | 340 | 11.3 | N/A | |
| Majority | 997 | ||||
| Turnout | 3,005 | 76.7 | |||
| Conservative hold | Swing | ||||
| Party | Candidate | Votes | % | ±% | |
|---|---|---|---|---|---|
| Labour | Jude Robinson | 538 | 29.3 | +4.1 | |
| Conservative | David Biggs | 530 | 28.9 | +4.1 | |
| UKIP | Peter Tisdale | 321 | 17.5 | -9.1 | |
| Liberal Democrats | Anna Pascoe | 268 | 14.6 | N/A | |
| Mebyon Kernow | Zoe Fox | 180 | 9.8 | -13.6 | |
| Majority | 8 | 0.4 | |||
| Turnout | 1,837 | 60.1 | +31.6 | ||
| Labour gain from UKIP | Swing | +4.8 | |||
| Party | Candidate | Votes | % | ±% | |
|---|---|---|---|---|---|
| Conservative | John Herd | 325 | 30.3 | +0.4 | |
| Liberal Democrats | Nathan Billings | 311 | 29.0 | N/A | |
| Labour | Val Dalley | 220 | 20.5 | +1.8 | |
| UKIP | Michael Pascoe | 89 | 8.3 | –23.5 | |
| Mebyon Kernow | Deborah Zoe Fox | 85 | 7.9 | –11.8 | |
| Green | Jacqueline Merrick | 31 | 2.9 | N/A | |
| Independent | Peter Channon | 13 | 1.2 | N/A | |
| Majority | 14 | ||||
| Turnout | 1,074 | 32.8 | |||
| Conservative gain from UKIP | Swing | ||||
| Party | Candidate | Votes | % | ±% | |
|---|---|---|---|---|---|
| Liberal Democrats | Gemma Massey | 515 | 63.0 | –7.8 | |
| Conservative | Val Bugden-Cawsey | 226 | 27.6 | +10.4 | |
| Green | Roger Michael Creagh-Osborne | 65 | 7.6 | N/A | |
| CPA | John Allman | 12 | 1.5 | N/A | |
| Majority | 289 | ||||
| Turnout | 818 | 31.0 | |||
| Liberal Democrats hold | Swing | ||||
| Party | Candidate | Votes | % | ±% | |
|---|---|---|---|---|---|
| Conservative | Phil Seeva | 532 | 40.5 | +2.5 | |
| Liberal Democrats | Charles Robert Boney | 472 | 35.9 | +11.6 | |
| UKIP | Duncan Charles Odgers | 177 | 13.5 | –17.7 | |
| Labour | Martin Thomas Menear | 67 | 5.1 | N/A | |
| Green | Richard John Sedgley | 65 | 5.0 | –1.5 | |
| Majority | 60 | ||||
| Turnout | 1,313 | 42.3 | |||
| Conservative hold | Swing | ||||
| Party | Candidate | Votes | % | ±% | |
|---|---|---|---|---|---|
| Liberal Democrats | Karen McHugh | 604 | 43.5 | +19.2 | |
| Conservative | Sally Marie Dunn | 356 | 25.6 | –39.3 | |
| Labour | Adrian Darrell Jones | 222 | 16.0 | +5.8 | |
| Independent | Helen Hyland | 111 | 8.0 | N/A | |
| Green | Amanda Pennington | 95 | 6.8 | N/A | |
| Majority | 248 | ||||
| Turnout | 1,388 | 47.8 | |||
| Liberal Democrats gain from Conservative | Swing | ||||
| Party | Candidate | Votes | % | ±% | |
|---|---|---|---|---|---|
| Liberal Democrats | Paul Summers | 486 | 57.8 | +32.9 | |
| Conservative | Carl Leadbetter | 210 | 25.0 | –2.1 | |
| Labour | Julian Grover | 87 | 10.3 | –7.4 | |
| Independent | Roy George Edwards | 58 | 6.9 | N/A | |
| Majority | 276 | ||||
| Turnout | 841 | 28.3 | |||
| Liberal Democrats gain from UKIP | Swing | ||||
| Party | Candidate | Votes | % | ±% | |
|---|---|---|---|---|---|
| Liberal Democrats | Dominic Fairman | 620 | 44.8 | +13.0 | |
| Independent | William Kitto | 242 | 17.5 | N/A | |
| Conservative | Jeremy Stanford-Davis | 202 | 14.6 | –2.1 | |
| Independent | Susan Theobald | 181 | 13.1 | N/A | |
| Independent | Edward Jones | 73 | 5.3 | N/A | |
| Labour | David Garrigan | 66 | 4.8 | N/A | |
| Majority | 378 | ||||
| Turnout | 1,384 | ||||
| Liberal Democrats gain from Independent | Swing | ||||
| Party | Candidate | Votes | % | ±% | |
|---|---|---|---|---|---|
| Liberal Democrats | Maggie Vale | 247 | 24.4 | N/A | |
| Conservative | Paul William Charlesworth | 234 | 23.1 | –23.0 | |
| Independent | Kenneth Yeo | 163 | 16.1 | N/A | |
| Mebyon Kernow | Rod Toms | 161 | 15.9 | -28.1 | |
| Labour | Vicky Crowther | 77 | 7.6 | -2.2 | |
| Independent | James Tucker | 75 | 7.4 | N/A | |
| Independent | Rob Thomas | 54 | 5.3 | N/A | |
| Majority | 13 | ||||
| Turnout | 1,011 | ||||
| Liberal Democrats gain from Conservative | Swing | ||||
| Party | Candidate | Votes | % | ±% | |
|---|---|---|---|---|---|
| Liberal Democrats | Nathan Billings | 300 | 34.7 | N/A | |
| Independent | Bernard Webb | 144 | 16.6 | N/A | |
| Conservative | Peter Sheppard | 128 | 14.8 | –5.8 | |
| Labour | Peter Williams | 125 | 14.5 | -5.7 | |
| Mebyon Kernow | Christopher Lawrence | 111 | 12.8 | -0.9 | |
| UKIP | Dan Hall | 57 | 6.6 | -21.9 | |
| Majority | 156 | 18.1 | |||
| Turnout | 865 | 24.5 | |||
| Liberal Democrats gain from UKIP | Swing | ||||
| Party | Candidate | Votes | % | ±% | |
|---|---|---|---|---|---|
| Labour | Jayne Susannah Kirkham | 643 | 60.2 | +19.9 | |
| Liberal Democrats | John Martin Spagro | 184 | 17.2 | -1.7 | |
| Conservative | Richard David Cunningham | 184 | 17.2 | -7.2 | |
| Green | Tom Martin Scott | 57 | 5.3 | -11.1 | |
| Majority | 459 | 43.0 | +27.1 | ||
| Turnout | 1,068 | 31.1 | -4.5 | ||
| Labour hold | Swing | +13.6 | |||
| Party | Candidate | Votes | % | ±% | |
|---|---|---|---|---|---|
| Conservative | Mark Anthony Formosa | 363 | 45.4 | +13.6 | |
| Liberal Democrats | Steven Daniell | 306 | 38.3 | -29.9 | |
| Labour | Brod Ross | 131 | 16.4 | +16.4 | |
| Majority | 57 | 7.1 | +21.8 | ||
| Turnout | 800 | 25.7 | -9.3 | ||
| Conservative gain from Liberal Democrats | Swing | +13.6 | |||

North Cornwall is a constituency represented in the House of Commons of the UK Parliament by Scott Mann, a Conservative since the 2015 general election. Like all British constituencies, the seat elects one Member of Parliament (MP) by the first past the post system of election at least every five years. The seat was created in 1918. Since 1950, the constituency has been held by MPs from either the Conservative Party or the Liberal Democrats.

One-third of Rushmoor Borough Council in Hampshire, England, is elected each year, followed by one year without election. From 1979, the council had 15 three-member wards, reduced to 14 wards in 2002 and 13 in 2012. Each ward elects 3 of the 39 councillors, one in each election year, for a term of four years, except in years when ward boundaries are changed when all councillors are elected for terms depending on their position in the poll.
Mid Suffolk District Council elections are held every four years to elect members of Mid Suffolk District Council in Suffolk, England. Since the last boundary changes in 2019, there have been 34 councillors elected from 26 wards.
Birmingham City Council elections are held every four years. Birmingham City Council is the local authority for the metropolitan district of Birmingham in the West Midlands, England. Since the last boundary changes in 2018, 101 councillors have been elected from 69 wards. Prior to 2018 elections were held three years out of every four, with a third of the council elected each time.
Forest Heath District Council in Suffolk, England was elected every four years. between the last boundary changes in 2003 and the final elections in 2015, 27 councillors were elected from 14 wards. The council was abolished in 2019, with the area becoming part of West Suffolk.
One third of Harrogate Borough Council in North Yorkshire, England was elected each year, followed by one year without election. Since the last boundary changes in 2002, 54 councillors had been elected from 35 wards. The last elections were held in 2018, ahead of the abolition of Harrogate Borough Council on 31 March 2023. Its functions transferred to the new North Yorkshire Council. The first elections to the North Yorkshire Council took place on 5 May 2022, when 21 councillors were elected from 21 divisions in the Borough of Harrogate.
Braintree District Council in Essex, England is elected every four years. Since the last comprehensive boundary changes in 2015, 49 councillors have been elected from 26 wards.
Stockton-on-Tees Borough Council elections are held every four years. Stockton-on-Tees Borough Council is the local authority for the unitary authority of Stockton-on-Tees, which straddles the ceremonial counties of County Durham and North Yorkshire, England. Until 1 April 1996 it was a non-metropolitan district in Cleveland.
Derbyshire County Council elections are held every four years. Derbyshire County Council is the upper-tier authority for the non-metropolitan county of Derbyshire in England. Since the last boundary changes in 2013, 64 councillors have been elected from 61 electoral divisions.
South Oxfordshire District Council, a non-metropolitan district council in Oxfordshire, England is elected every four years.
East Lindsey District Council in Lincolnshire, England is elected every four years. The district is divided into 37 wards, electing 55 councillors. The last ward boundary changes came into effect in 2015.
North Norfolk District Council in Norfolk, England is elected every four years.
Rotherham Metropolitan Borough Council is the local authority for Rotherham in South Yorkshire, England. The council is elected every four years. Since the last boundary changes in 2004, 63 councillors have been elected from 21 wards.
One third of the City of Lincoln Council in Lincolnshire, England is elected each year, followed by one year when there is an election to Lincolnshire County Council instead. Since the last boundary changes in 2016 the council has comprised 33 councillors representing 11 wards, with each ward electing three councillors.

Cornwall is administered as a county of South West England whose politics are influenced by a number of issues that make it distinct from the general political scene in the wider United Kingdom, and the political trends of neighbouring counties. Its position on the geographical periphery of the island of Great Britain is also a factor.
Elections to Maidstone Borough Council in Kent, United Kingdom are held each year to elect one-third of its members, followed by one year without election. Since the last boundary changes in 2002, 55 councillors have been elected from 26 wards. From 2023 onwards, the format of elections will change, with all 55 councillors being elected once every 4 years.
The Cornwall Council election, 2009, was an election for all 123 seats on the council. Cornwall Council is a unitary authority that covers the majority of the ceremonial county of Cornwall, with the exception of the Isles of Scilly which have an independent local authority. The elections took place concurrently with other local elections across England and Wales as well as the UK component of the elections to the European Parliament. Cornwall had seen its district and county councils abolished, replaced by a single 123-member Cornish unitary authority, for which councillors were elected for a full term.
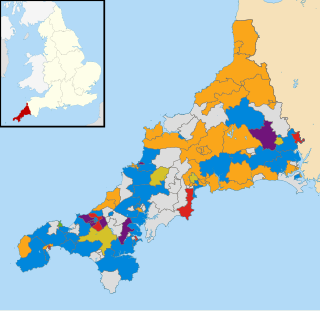
The Cornwall Council election, 2013, was an election for all 123 seats on the council. Cornwall Council is a unitary authority that covers the majority of the ceremonial county of Cornwall, with the exception of the Isles of Scilly which have an independent local authority. The elections took place concurrently with other local elections across England and Wales.

The 2021 Cornwall Council election took place on 6 May 2021 as part of the 2021 United Kingdom local elections. It was contested under new division boundaries as the number of seats on the council falls from 123 to 87. The election was won by the Conservative Party, who took an overall majority of seats.