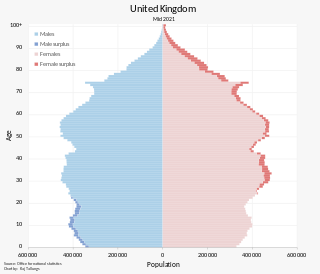
The population of the United Kingdom was estimated at over 67.0 million in 2020. It is the 21st most populated country in the world and has a population density of 270 people per square kilometre, with England having significantly greater density than Wales, Scotland, and Northern Ireland. Almost a third of the population lives in south east England, which is predominantly urban and suburban, with about 9 million in the capital city, London, whose population density is just over 5,200 per square kilometre.

Demographics of Wales include the numbers in population, place of birth, age, ethnicity, religion, and number of marriages in Wales.

The demography of England has since 1801 been measured by the decennial national census, and is marked by centuries of population growth and urbanization. Due to the lack of authoritative contemporary sources, estimates of the population of England for dates prior to the first census in 1801 vary considerably. The population of England at the 2021 census was about 56,489,800.
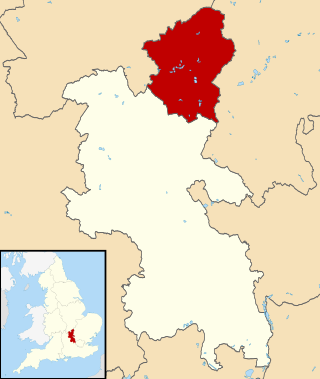
The City of Milton Keynes is a unitary authority area with both borough and city status, in Buckinghamshire. It is the northernmost district of the South East England Region. The borough abuts Bedfordshire, Northamptonshire and the remainder of Buckinghamshire.

The demography of London is analysed by the Office for National Statistics and data is produced for each of the Greater London wards, the City of London and the 32 London boroughs, the Inner London and Outer London statistical sub-regions, each of the Parliamentary constituencies in London, and for all of Greater London as a whole. Additionally, data is produced for the Greater London Urban Area. Statistical information is produced about the size and geographical breakdown of the population, the number of people entering and leaving country and the number of people in each demographic subgroup. The total population of London as of 2021 is 8,799,800.
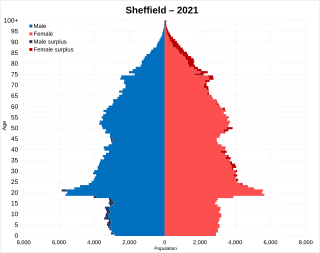
The latest (2021) population estimate for the City of Sheffield is 554,401 residents. This represents an increase of about 17,000 people since the last census in 2011.
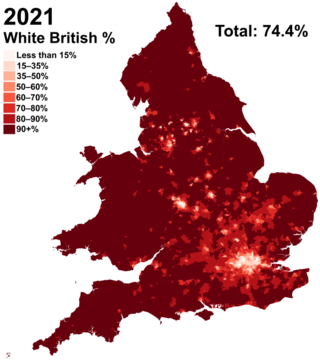
White British is an ethnicity classification used for the native white population identifying as English, Scottish, Welsh, Cornish, Northern Irish, or British in the United Kingdom Census. In the 2011 census, the White British population was 49,997,686, 81.5% of Great Britain's total population. For the United Kingdom entirely, due to different reporting measures within Northern Ireland which includes all those who identified as British with those who identified as Irish, an amalgamated total of 52,320,080 including those who identified as White Irish in Great Britain is given making up 82.8% of the population.
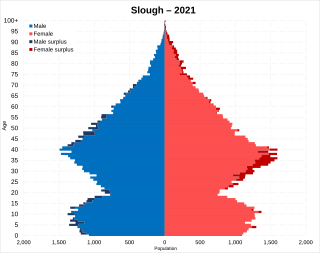
This article is intended to give an overview of the demography of Slough. In 2016, Slough had a population of 149,000 people.

The demography of Birmingham, England, is analysed by the Office for National Statistics and data produced for each of the wards that make up the city, and the overall city itself, which is the largest city proper in England as well as the core of the third most populous urban area, the West Midlands conurbation.
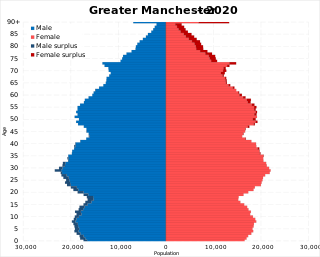
The demography of Greater Manchester is analysed by the Office for National Statistics and data is produced for each of its ten metropolitan boroughs, each of the Greater Manchester electoral wards, the NUTS3 statistical sub-regions, each of the Parliamentary constituencies in Greater Manchester, the 15 civil parishes in Greater Manchester, and for all of Greater Manchester as a whole; the latter of which had a population of 2,682,500 at the 2011 UK census. Additionally, data is produced for the Greater Manchester Urban Area. Statistical information is produced about the size and geographical breakdown of the population, the number of people entering and leaving country and the number of people in each demographic subgroup.

London, the capital of England and the United Kingdom, has become one of the most ethnically diverse and multicultural cities in the world.
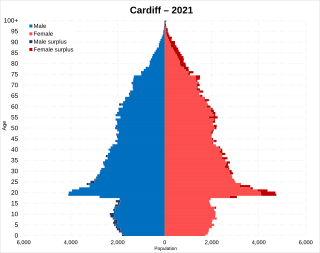
This article presents the historical demographics of Cardiff, capital city of Wales in the United Kingdom.

Leicester, England is an ethnically and culturally diverse city. It is the thirteenth most populous city in the United Kingdom.

Nottingham, England is an ethnically and culturally diverse city. It is the sixteenth most populous city in the United Kingdom.

Luton, Bedfordshire, England is an ethnically and culturally diverse town of 203,201 people. It's primarily urban, with a population density of 4,696/km2 (12,160/sq mi). Luton has seen several waves of immigration. In the early part of the 20th century, there was internal migration of Irish and Scottish people to the town. These were followed by Afro-Caribbean and Asian immigrants. More recently immigrants from other European Union countries have made Luton their home. As a result of this Luton has a diverse ethnic mix, with a significant population of Asian descent, mainly Pakistani 29,353 (14.4%) and Bangladeshi 13,606 (6.7%).

Leeds, England is the third most populous city in the United Kingdom.

Bristol, England is the tenth most populous city in the United Kingdom.

Coventry, England is an ethnically and culturally diverse city. It is the fifteenth most populous city in the United Kingdom.
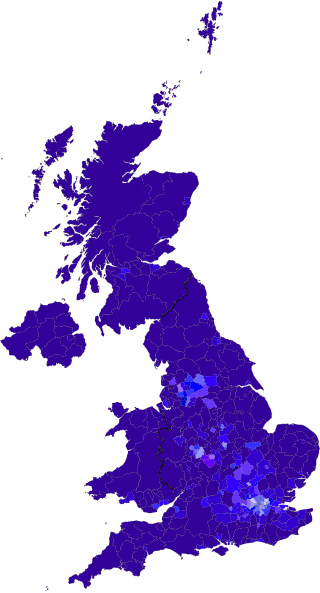
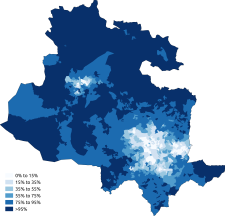
White people in the United Kingdom are a multi-ethnic group of UK residents who identify as and are perceived to be 'white people'. White people constitute the historical and current majority of the people living in the United Kingdom, with 87.2% of the population identifying as white in the 2011 United Kingdom census.
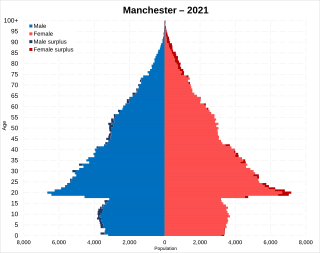
Manchester is a populous city in the North West of England. Its total population as of 2021 is 551,938.


 White
White White-British
 White-Irish
 White-Other
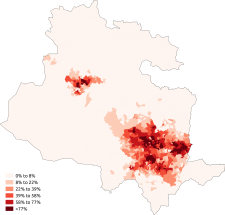 Asian
Asian Asian-Indian
 Asian-Pakistani
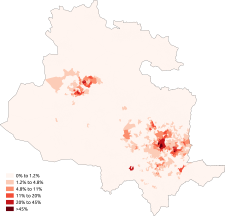 Asian-Bangladeshi
 Asian-Chinese
 Black
Black Black-African
 Black-Caribbean
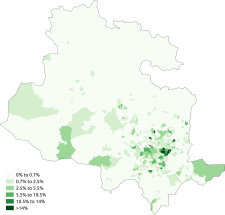 Other-Arab