Demographics of Paraguay

Last updated

Demographics of Paraguay
Paraguay single age population pyramid 2020.png
Population pyramid of Paraguay in 2020
Population6,109,644 (2022 census) [1]
Growth rate0.89% (2022 census)
Birth rate16.32 births/1,000 population (2022 est.)
Death rate4.87 deaths/1,000 population (2022 est.)
Life expectancy78.37 years
Fertility rate2.4 children born/woman (2022 census)
Infant mortality rate23.21 deaths/1,000 live births
Net migration rate-0.07 migrant(s)/1,000 population (2022 est.)
Age structure
0–14 years24.3%
15–64 years66.9%
65 and over8.8%
Nationality
NationalityParaguayan
Language
OfficialSpanish and Guarani
Historical population
YearPop.±%
1950 1,328,452    
1962 1,819,103+36.9%
1972 2,357,955+29.6%
1982 3,029,830+28.5%
1992 4,152,588+37.1%
2002 5,163,198+24.3%
2012 6,461,041+25.1%
2022 6,109,644−5.4%
Source: [2]

Demographic features of the population of Paraguay include population density, ethnicity, education level, health of the populace, economic status, religious affiliations and other aspects of the population.

Contents

Characteristics

The Paraguay's predominant ancestry is European, which represents a large part of the population, mainly descendants of Spaniards and Italians (who have contributed to repopulating the country after the Triple Alliance War) but there are also a large number of people of German ancestry, due to the German Mennonites (majority in the western part of the territory). There are 17 Mennonite colonies, only in the Paraguayan Chaco. It is one of the Latin American countries with the least indigenous traits (due to the fact that the traditional Paraguayan population; the Spanish mixture of Guaraní, had been annihilated by the war in 1870, which is why the country had to repopulate by resorting to immigration, especially the Italian in that country.) Taking into account the high fertility, Paraguay registers a majority young population structure. Of every ten people, four are under the age of 15 (2,339,000) and the population aged 15 to 29 represents a quarter of the total population. According to the Census (ECLAC, 1998), the population of indigenous nature that year was 29,482 people, that is, about 0.7% of the national population. There is a low percentage of people with distinctively Amerindian features and the absence of people with African features. The majority of the population is made up of mestizos who are descendants of the original population, the Guarani, and Europeans.

Paraguay Embassy in Germany [3]

Paraguay's population is distributed unevenly through the country. The vast majority of the people live in the eastern region, most within 160 kilometres (99 mi) of Asunción, the capital and largest city, which borders on Argentina to the south and west. The Gran Chaco in the north-west, which accounts for about 60% of Paraguayan territory, is home to less than 2% of the population. The Paraguay government encouraged[ when? ] massive settlement of the vast Gran Chaco.

Ethnically, culturally, and socially, Paraguay has one of the most homogeneous populations in South America. About 75% of the people are mestizo (mixed Spanish and Guaraní Native American descent), 20% are Whites, and the rest are small minorities of Indigenous or Afro Paraguayan origin. [4] Little trace is left of the original Guaraní culture except the language, which is spoken by 90% of the population. About 75% of all Paraguayans also speak Spanish. Guaraní and Spanish are official languages.

Paraguay has a history of foreign settlement, especially in the 20th century: Germans (the majority are Mennonites) with long-time Paraguayan dictator Alfredo Stroessner (President, 1954-1989) himself of German ancestry; Italians (around 40% of the total Paraguayan population is of full or partial Italian descent); [5] [6] [7] Japanese with Okinawans; Koreans; Chinese; Arabs, Ukrainians; Poles; Southern Europeans; Jews; Brazilians; and Argentines are among those who have settled in Paraguay. There are also an estimated 234,000 Afro-Paraguayans, or 4% of the population. [8]

European and Middle Eastern immigrants began making their way to Paraguay in the decades following the Paraguayan War of 1864-1870 (from 1870 onward). Only 28,000 men and 200,000 women had survived the war, the reason why Paraguay had since then a high rate of illegitimate births. The government pursued a pro-immigration policy in an effort to increase population. Government records indicated that approximately 12,000 immigrants entered the port of Asunción between 1882 and 1907, of whom almost 9,000 came from Italy, Germany, France, and Spain. Migrants also arrived from neighboring Spanish American countries, especially Argentina. The immigrant ethnic groups kept their cultures and languages to some extent, especially Brazilians - known as "Brasiguayos". [9] [10]

Official records gave an imprecise sense of the number of Brazilians who came to the country. According to the 1982 census, 99,000 Brazilians resided in Paraguay. Most[ quantify ] analysts discounted this figure, however, and contended that between 300,000 and 350,000 Brazilians lived in the eastern border region.

Analysts also rejected government figures on the number of immigrants from South Korea, Hong Kong and Taiwan. The 1982 census reported that there were 2,700 Koreans in Paraguay, along with another 1,100 non-Japanese or non-Korean Asian immigrants. Virtually all Koreans and Chinese lived in Ciudad del Este or Asunción and played a major role in the importation and sale of electronic goods manufactured in Asia.

Paraguay became the site of radical and progressive colonies inspired by political thinkers of the late 19th and early 20th centuries. A group of radical socialist Australians in the 1890s voluntarily went to create a failed master-planned community, known as Nueva (New) Australia (1893 -1897); and Elisabeth Nietzsche, a German racial ideologist and sister of philosopher Friedrich Nietzsche came to Paraguay in her attempt to build a colony, Nueva Germania (Neues Deutschland) (founded 1886) devoted to a hypothetical pure white "Nordic" society.

A 2022 census found that Paraguay's population shrank as a production of migration and having smaller families, as well as better data integrity, resulting in a loss of over one million. [11]

Population

Demographics of Paraguay, Data of Our World in Data, year 2022; Number of inhabitants in thousands. Paraguay-demography.png
Demographics of Paraguay, Data of Our World in Data, year 2022; Number of inhabitants in thousands.
Paraguay population density (people per km ) Paraguay population density.png
Paraguay population density (people per km )

According to the 2022 revision of the World Population Prospects [12] [13] the total population was 6,703,799 in 2021, compared to only 1,473,000 in 1950. The proportion of children below the age of 15 in 2010 was 33.5%, 61.4% was between 15 and 65 years of age, while 5.1% was 65 years or older . [14]

Total population
(x 1000)
Proportion
aged 0–14
(%)
Proportion
aged 15–64
(%)
Proportion
aged 65+
(%)
19501 47347.050.12.9
19551 67447.549.53.0
19601 90647.849.03.2
19652 17647.549.23.3
19702 48346.150.43.5
19752 80244.152.33.6
19803 19542.553.83.8
19853 69841.654.53.9
19904 24441.454.64.0
19954 79540.355.44.3
20005 32338.557.24.4
20055 82435.559.84.7
20106 24832.961.85.2
20156 68930.463.75.9
20207 13328.964.36.8

Structure of the population

Population Estimates by Sex and Age Group (01.VII.2013) (Projections based on the 2002 Population Census.): [15]
Age GroupMaleFemaleTotal%
Total3 426 5083 356 8676 783 374100
0–4377 989363 561741 55010.93
5–9372 142358 751730 89310.77
10–14364 020351 350715 36910.55
15–19351 038339 645690 68310.18
20–24331 748322 813654 5619.65
25–29303 291297 128600 4198.85
30–34257 335252 770510 1047.52
35–39203 351200 858404 2095.96
40–44173 976173 202347 1775.12
45–49160 044158 383318 4274.69
50–54140 818137 891278 7094.11
55–59120 438116 493236 9313.49
60–6495 42492 423187 8482.77
65–6967 62367 777135 4012.00
70–7447 77850 65398 4311.45
75–7931 69436 08567 7791.00
80+27 80037 08264 8820.96
Age groupMaleFemaleTotalPercent
0–141 114 1511 073 6622 187 81332.25
15–642 312 3572 091 6084 403 96564.92
65+174 895191 597366 4925.40
Population Estimates by Sex and Age Group (01.VII.2021) (Estimates or projections considering also the results of the 2012 Population Census.): [16]
Age GroupMaleFemaleTotal%
Total3 702 2813 650 7587 353 038100
0–4360 793346 324707 1189.62
5–9357 301343 724701 0259.53
10–14352 757340 126692 8839.42
15–19344 522332 510677 0329.21
20–24334 496322 993657 4898.94
25–29318 925309 559628 4848.55
30–34300 116293 132593 2478.07
35–39266 102262 734528 8367.19
40–44214 813217 042431 8555.87
45–49185 967188 348374 3155.09
50–54164 693166 184330 8774.50
55–59141 237142 195283 4323.85
60–64120 322119 145239 4673.26
65-6994 45094 556189 0062.57
70-7463 85566 647130 5021.77
75-7941 07046 12087 1911.19
80+40 86359 417100 2801.36
Age groupMaleFemaleTotalPercent
0–141 070 8511 030 1742 101 02528.57
15–642 391 1922 353 8444 745 03664.53
65+240 238266 740506 9786.89

Vital statistics

Registration of vital events in Paraguay are not complete. The Population Department of the United Nations prepared the following estimates. [14]

PeriodLive births
per year
Deaths
per year
Natural change
per year
CBR*CDR*NC*TFR*IMR*Life expectancy
total
Life expectancy
males
Life expectancy
females
1950–195570,00014,00056,00044.38.935.46.507362.660.564.6
1955–196076,00015,00061,00042.78.634.16.507063.261.165.1
1960–196584,00016,00068,00041.38.033.36.456264.362.366.3
1965–197092,00018,00074,00039.57.631.86.155965.063.066.9
1970–197594,00019,00075,00035.67.128.65.355365.963.768.0
1975–1980108,00021,00087,00036.16.929.25.205166.564.368.7
1980–1985129,00024,000105,00037.36.830.45.204967.064.969.3
1985–1990139,00026,000113,00034.96.628.34.774767.665.469.9
1990–1995145,00028,000117,00032.06.225.84.314368.566.370.8
1995–2000148,00030,000118,00029.35.923.33.883969.467.271.7
2000–2005151,00032,000119,00025.15.419.73.243670.768.772.9
2005–2010153,00034,000119,00023.45.418.02.893271.769.773.9
2010–2015161,00038,000123,00021.75.416.32.603072.270.074.5
2015–2020165,00043,000122,00020.75.515.22.452872.770.475.1
2020–202519.45.713.72.33
2025–203018.06.012.02.23
* CBR = crude birth rate (per 1000); CDR = crude death rate (per 1000); NC = natural change (per 1000); IMR = infant mortality rate per 1000 births; TFR = total fertility rate (number of children per woman)

Estimated births and deaths

Year [17] PopulationLive birthsDeathsNatural increaseCrude birth rateCrude death rateRate of natural increaseTFR
20096,168,757103,30918,75884,55116.73.013.7
20106,265,877100,58421,28179,30316.13.412.7
20116,363,276111,94522,65289,29317.63.614.0
20126,461,041118,54922,80795,75218.33.514.8
20136,559,027114,61924,19390,42617.53.713.8
20146,657,232116,59222,62593,96717.53.414.1
20156,755,756132,24124,885107,35619.63.715.9
20166,854,536128,11727,243100,87418.74.014.7
20176,953,646129,90326,404103,49918.73.814.9
20187,052,983123,18729,13994,04817.54.113.4
20197,152,703117,34732,36284,98516.44.511.9
2020 [18] 7,252,67295,64936,46659,18313.25.08.22.41
2021 [19] 7,353,038112,96650,89863,31415.46.98.5
2022 (c)6,109,644 [20] 111,99238,35673,63618.36.411.9

(c) = 2022 census preliminary results.

Total fertility rate

[22] Total Fertility Rate (Wanted Fertility Rate):

YearTFR (Total)
19904.6
1995/964.3
19984.3
20042.9
20082,5 (2,2)

Ethnic groups

Ethnic groups of Paraguay [4]
Ethnic groupspercent
Mestizo
75%
White
20%
Afro-Paraguayans
0.13%
Indigenous
1.7%

Religions

Religions of Paraguay [4]
Religionspercent
Roman Catholic
89.6%
Protestant
6.2%
Other or Unspecified
1.9%
Other Christian
1.1%
None
1.1%

Languages

Languages of Paraguay
Languagespercent
Guaraní
90%
Spanish
87%

CIA World Factbook demographic statistics

The following demographic statistics are from the CIA World Factbook, unless otherwise indicated. [23] [24]

Age structure

Dependency ratios

Median age

Population growth rate

Sex ratio

HIV/AIDS – adult prevalence rate

0.3% (2020 est.)

HIV/AIDS – people living with HIV/AIDS

19,000 (2020 est.)

HIV/AIDS – deaths

<500 (2020 est.)

Literacy

Related Research Articles

<span class="mw-page-title-main">Demographics of Botswana</span> Demographics of country

Demographic features of the population of Botswana include population density, ethnicity, education level, health of the populace, economic status, religious affiliations and other aspects.

<span class="mw-page-title-main">Demographics of Cape Verde</span>

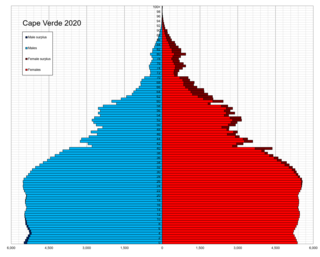
Demographic features of the population of Cape Verde include population density, ethnicity, education level, health of the populace, economic status, religious affiliations and other aspects of the population.

<span class="mw-page-title-main">Demographics of Costa Rica</span>

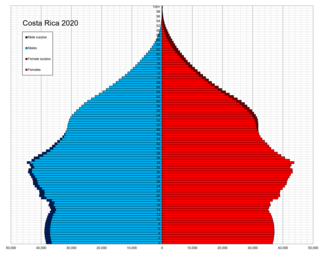
This is a demographic article about Costa Rica's population, including population density, ethnicity, education level, health of the populace, economic status, religious affiliations, and other aspects of the population.

<span class="mw-page-title-main">Demographics of the Dominican Republic</span>

This is a demography of the population of the Dominican Republic including population density, ethnicity, education level, health of the populace, economic status, religious affiliations and other aspects of the population.

<span class="mw-page-title-main">Demographics of Guatemala</span>

This is a demography of the population of Guatemala including population density, ethnicity, education level, health of the populace, economic status, religious affiliations and other aspects of the population.

<span class="mw-page-title-main">Demographics of Honduras</span>

This article is about the ethnic groups and population of Honduras.

<span class="mw-page-title-main">Demographics of Nicaragua</span>

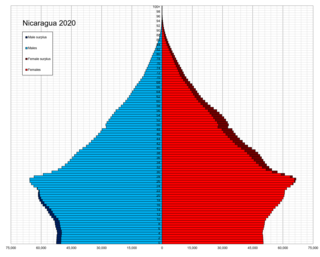
According to the 2022 revision of the World Population Prospects, Nicaragua has a population of 6,850,540..According to a 2014 research published in the journal Genetics and Molecular Biology, European ancestry predominates in 69% of Nicaraguans, followed by African ancestry in 20%, and lastly indigenous ancestry in 11%. A Japanese research of "Genomic Components in America's demography" demonstrated that, on average, the ancestry of Nicaraguans is 58–62% European, 28% Native American, and 14% African, with a very small Near Eastern contribution. Non-genetic data from the CIA World Factbook establish that from Nicaragua's 2016 population of 5,966,798, around 69% are mestizo, 17% white, 5% Native American, and 9% black and other races. This fluctuates with changes in migration patterns. The population is 58% urban as of 2013.

<span class="mw-page-title-main">Paraguay</span> Country in South America

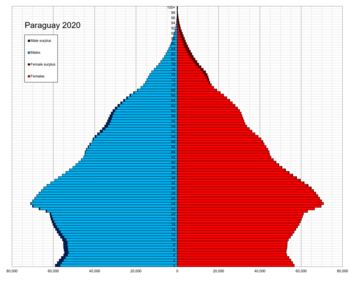
Paraguay, officially the Republic of Paraguay, is a landlocked country in South America. It is bordered by Argentina to the south and southwest, Brazil to the east and northeast, and Bolivia to the northwest. It has a population of around 6.1 million, nearly 2.3 million of whom live in the capital and largest city of Asunción, and its surrounding metro area.

<span class="mw-page-title-main">History of Paraguay</span>

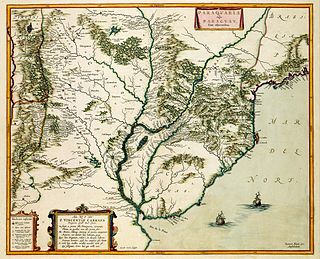
The history of Paraguay encompasses thousands of years of human habitation. Both agricultural and nomadic Guaycuruan lived in the region at the time of the Spanish Conquest. It became a relatively neglected part of the Spanish Empire due to its isolation and lack of mineral wealth, nonetheless a small group of Spanish settlers came to reside in the area, increasingly intermarrying with native women to produce a mestizo population. In the 17th and 18th centuries, Jesuit missionaries organized the natives into planned communities known as reducciones, and the experiment gained notable attention in Enlightenment Era Europe.

<span class="mw-page-title-main">Demographics of Uruguay</span> Demographics of country

This is a demography of the population of Uruguay including population density, ethnicity, education level, health of the populace, economic status, religious affiliations and other aspects of the population.

<span class="mw-page-title-main">Demographics of Venezuela</span>

Venezuela is a country in South America. The Venezuelan people comprise a combination of heritages, primarily Native American and European. The historically present Native American, Spanish colonists, and African slaves have all contributed to varying degrees. Later, waves of European groups migrated to Venezuela in the 20th century, influencing many aspects of Venezuelan life, including its culture, language, food, and music though small in number.

<span class="mw-page-title-main">Asunción</span> Capital and chief port of Paraguay

Asunción is the capital and the largest city of Paraguay. The city stands on the eastern bank of the Paraguay River, almost at the confluence of this river with the Pilcomayo River. The Paraguay River and the Bay of Asunción in the northwest separate the city from the Occidental Region of Paraguay and from Argentina in the south part of the city. The rest of the city is surrounded by the Central Department.

<span class="mw-page-title-main">Demographics of Argentina</span>

This is a demography of Argentina including population density, ethnicity, economic status and other aspects of the population.

<span class="mw-page-title-main">Demographics of Belize</span> Demographics of country

Demographics of the population of Belize include population density, ethnicity, education level, health of the populace, economic status, religious affiliations and other aspects.

<span class="mw-page-title-main">Demographics of Cuba</span>

The demographic characteristics of Cuba are known through census which have been conducted and analyzed by different bureaus since 1774. The National Office of Statistics of Cuba (ONE) since 1953. The most recent census was conducted in September 2012. The population of Cuba at the 2012 census was nearly 11.2 million. The population density is 101 inhabitants per square kilometer, and the overall life expectancy in Cuba is 78.0 years. The population has always increased from one census to the next in the 20th century, with the exception of the 2012 census, when the count decreased by 10,000. Since 1740, Cuba's birth rate has surpassed its death rate; the natural growth rate of the country is positive. Cuba is in the fourth stage of demographic transition. In terms of age structure, the population is dominated (71.1%) by the 15- to 64-year-old segment. The median age of the population is 39.5, making it the oldest in the Americas, and the gender ratio of the total population is 0.99 males per female.

<span class="mw-page-title-main">Religion in Paraguay</span>

Christianity is the predominant religion in Paraguay, with Catholicism being its largest denomination. Before the arrival of Spanish missionaries, the people residing in the territory of modern day Paraguay practiced a variety of religions.

<span class="mw-page-title-main">Demographics of Colombia</span>

The demographics of Colombia consist of statistics regarding Colombians' health, economic status, religious affiliations, ethnicity, population density, and other aspects of the population. Colombia is the second-most populous country in South America after Brazil, and the third-most populous in Latin America, after Brazil and Mexico.

<span class="mw-page-title-main">Paraguayan Argentines</span> Large ethnic group

Paraguayan Argentines are Argentine citizens of full or partial Paraguayan descent or Paraguay-born people who reside in Argentina. Paraguayan people comprise an important ethnic group in the country due to the sustained immigration that gained importance in the 1970s. The number of people born in Paraguay living in Argentina has been estimated to be about 550,000. Therefore, it is the largest foreign community in the country outnumbering individuals from Italy and Spain. It is also one of the fastest growing foreign nationalities. Despite all this, its numbers have been undercounted so it is believed that the real amount is even much higher.

<span class="mw-page-title-main">Languages of Paraguay</span>

The Republic of Paraguay is a mostly bilingual country, as the majority of the population uses Spanish and Guaraní. The Constitution of Paraguay of 1992 declares it as a multicultural and bilingual country, establishing Spanish and Guaraní as official languages. Spanish, an Indo-European language of the Romance branch, is understood by about 90% of the population as a first or second language. Guaraní, an indigenous language of the Tupian family, is understood by 77%, and its use is regulated by the Academy of the Guaraní Language.

<span class="mw-page-title-main">Immigration to Paraguay</span>

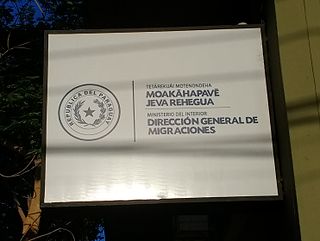
Historically, the migratory history of Paraguay has been ambiguous, since it has had periods of large scale emigration as well as large waves of immigrants, primarily from Europe.

References

  1. "Paraguay has 6,109,644 inhabitants, according to the last Census". ABC Color (in Spanish). 31 August 2023.
  2. "Evolución de la Población Total". DGEEC. Retrieved 27 July 2017.
  3. "Paraguay population's ethnicity & data".
  4. 1 2 3 Francisco Lizcano Fernández (2005). "Composición Étnica de las Tres Áreas Culturales del Continente Americano al Comienzo del Siglo XXI" [Ethnic Composition of the Three Cultural Areas of the American Continent at the Beginning of the 21st Century]. Convergencia. Revista de Ciencias Sociales (in Spanish). 12 (38): 185–232.
  5. "Italianos en el Paraguay elegirán representantes" (in Spanish). 1 December 2014. Archived from the original on 31 March 2019. Retrieved 17 December 2018.
  6. "Los italianos y su aporte a la nación - Articulos - ABC Color".
  7. "Ya se puede sacar la nacionalidad italiana" (in Spanish). Retrieved 29 May 2020.
  8. "Afro-Latino: A deeply rooted identity among U.S. Hispanics".
  9. Hilton, Ronald (15 June 2001). "BRAZIL: Brazilians in Paraguay" . Retrieved 19 January 2017.
  10. "Culture of Paraguay - history, people, clothing, traditions, women, beliefs, food, customs, family". www.everyculture.com. Retrieved 19 January 2017.
  11. "Over a million Paraguayans disappear in the latest census". The Americas. The Economist . 6 October 2023. Retrieved 15 November 2023.
  12. "World Population Prospects 2022". United Nations Department of Economic and Social Affairs, Population Division. Retrieved 17 July 2022.
  13. "World Population Prospects 2022: Demographic indicators by region, subregion and country, annually for 1950-2100" (XSLX) ("Total Population, as of 1 July (thousands)"). United Nations Department of Economic and Social Affairs, Population Division. Retrieved 17 July 2022.
  14. 1 2 "World Population Prospects - Population Division - United Nations". esa.un.org. Archived from the original on 6 May 2011.
  15. "Demographic Yearbook". United Nations Statistics Division .[ not specific enough to verify ]
  16. "UNSD — Demographic and Social Statistics". unstats.un.org. Retrieved 10 May 2023.
  17. "Live births, deaths, and infant deaths, latest available year (2002–2016)" (PDF). United Nations Statistics Division . 2 January 2018.
  18. "Proyecciones de población nacional, áreas urbana y rural, por sexo y edad, PARAGUAY 2020" (PDF). Instituto Nacional de Estadistica. Retrieved 2 June 2021.
  19. "Proyecciones de población nacional, áreas urbana y rural, por sexo y edad, PARAGUAY 2021" (PDF). Instituto Nacional de Estadistica. Retrieved 2 June 2021.
  20. "Resultados preliminares del Censo 2022" (PDF). Insitituto Nacional de Estadística de Paraguay. Archived from the original (PDF) on 31 August 2023. Retrieved 1 September 2023.
  21. Ritchie, Hannah; Mathieu, Edouard; Rodés-Guirao, Lucas; Appel, Cameron; Giattino, Charlie; Ortiz-Ospina, Esteban; Hasell, Joe; MacDonald, Bobbie; Beltekian, Diana; Roser, Max (5 March 2020). "Excess mortality using raw death counts". Our World in Data. Retrieved 23 January 2023.
  22. "Archived copy" (PDF). Archived from the original (PDF) on 1 July 2013. Retrieved 19 July 2014.{{cite web}}: CS1 maint: archived copy as title (link)
  23. "The World Factbook – Paraguay". 8 March 2022.
  24. "IndexMundi". Archived from the original on 29 November 2022. Retrieved 25 December 2022.