This article is a demography of the population of Antigua and Barbuda including population density, ethnicity, religious affiliations and other aspects of the population.

Demographic features of the population of Botswana include population density, ethnicity, education level, health of the populace, economic status, religious affiliations and other aspects.
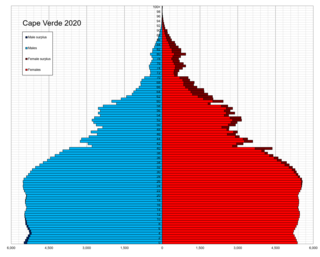
This article is about the demographic features of the population of Cape Verde, including population density, ethnicity, education level, health of the populace, economic status, religious affiliations and other aspects of the population.
This is a demography of the population of Dominica including population density, ethnicity, religious affiliations and other aspects of the population.

This is a demography of the population of the Dominican Republic including population density, ethnicity, education level, health of the populace, economic status, religious affiliations and other aspects of the population.
Demographic features of the population of French Polynesia include population density, ethnicity, education level, health of the populace, economic status, religious affiliations and other aspects.

Demographic features of the population of the Federated States of Micronesia include population density, ethnicity, education level, health of the populace, economic status, religious affiliations and other aspects. The indigenous population of the Federated States of Micronesia, which is predominantly Micronesian, consists of various ethnolinguistic groups. English has become the common language. Population growth remains high at more than 3%, but is ameliorated somewhat by net emigration.
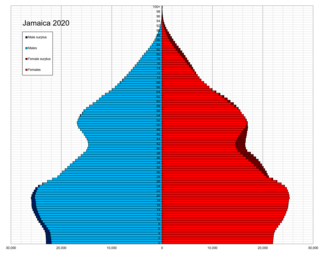
Jamaica is an island country in the Caribbean. The country had a population of 2,818,596 in 2022, the fourth largest in the region.

This article is about the demographic features of the population of Kiribati, including population density, ethnicity, education level, health of the populace, economic status, religious affiliations and other aspects of the population.

Demographic features of the population of Lesotho include population density, ethnicity, education level, health of the populace, economic status, religious affiliations and other aspects.
This is a demography of the population of Monaco, including population density, ethnicity, education level, health of the populace, economic status, religious affiliations and other aspects of the population.

This article is about the demographic features of the population of New Caledonia, including population density, ethnicity, education level, health of the populace, economic status, religious affiliations and other aspects of the population.
Demographic features of the population of the Northern Mariana Islands include population density, ethnicity, education level, health of the populace, economic status, religious affiliations and other aspects.
Demographic features of the population of Palau include population density, ethnicity, education level, health of the populace, economic status, religious affiliations and other aspects.
This is a demography of the population of Saint Pierre and Miquelon including population density, ethnicity, education level, health of the populace, economic status, religious affiliations and other aspects of the population.

This article is about the demographic features of the population of Samoa, including population density, ethnicity, education level, health of the populace, economic status, religious affiliations and other aspects of the population.

Demographic features of the population of Solomon Islands include population density, ethnicity, education level, health of the populace, economic status, religious affiliations and other aspects.
Demographic features of the population of Wallis and Futuna include population density, ethnicity, education level, health of the populace, economic status, religious affiliations and other aspects.

The demographic characteristics of the population of Fiji are known through censuses, usually conducted in ten-year intervals, and has been analysed by statistical bureaus since the 1880s. The Fijian Bureau of Statistics (FBOS) has performed this task since 1996, the first enumerated Fiji census when an independent country. The 2017 census found that the permanent population of Fiji was 884,887, compared to 837,271 in the 2007 census. The population density at the time in 2007 was 45.8 inhabitants per square kilometre, and the overall life expectancy in Fiji was 67 years. Since the 1930s the population of Fiji has increased at a rate of 1.1% per year. Since the 1950s, Fiji's birth rate has continuously exceeded its death rate. The population is dominated by the 15–64 age segment. The median age of the population was 27.9, and the gender ratio of the total population was 1.03 males per 1 female.

This is a demography of the population of The Bahamas including population density, ethnicity, education level, health of the populace, economic status, religious affiliations and other aspects of the population.