Demographics of the United Arab Emirates

Last updated

Demographics of United Arab Emirates
United Arab Emirates single age population pyramid 2020.png
Population pyramid of the United Arab Emirates in 2020
Population9,915,803 (2022 est.)
Growth rate0.58% (2022 est.)
Birth rate10.81 births/1,000 population (2022 est.)
Death rate1.56 deaths/1,000 population (2022 est.)
Life expectancy79.56 years
  male78.21 years
  female80.99 years
Fertility rate1.64 children born/woman (2022 est.)
Infant mortality rate5.14 deaths/1,000 live births
Net migration rate3.45 migrant(s)/1,000 population (2022 est.)
Age structure
0–14 years14.45%
15–64 years83.65%
65 and over1.90%
Sex ratio
Total2.21 male(s)/female (2022 est.)
At birth1.06 male(s)/female
Under 151.06 male(s)/female
65 and over1.86 male(s)/female
Nationality
NationalityEmirati
Language
OfficialArabic
SpokenArabic, English, Hindi–Urdu, Malayalam, Pashto, Tagalog, Persian

Demographic features of the United Arab Emirates (UAE) include population density, vital statistics, immigration and emigration data, ethnicity, education levels, religions practiced, and languages spoken within the UAE.

Contents

Population

Historical population
YearPop.±% p.a.
1963 95,000    
1968 180,226+13.66%
1975 557,887+17.52%
1980 1,042,099+13.31%
1985 1,379,303+5.77%
1995 2,411,041+5.74%
1999 2,938,000+5.07%
2005 4,106,427+5.74%
2010 8,264,070+15.01%
2011 8,925,096+8.00%
2012 9,205,651+3.14%
2013 9,346,129 [1] +1.53%
2016 9,269,610 [1] −0.27%
2018 9,599,353 [2] +1.76%
Sources: [3] [4]

The United Arab Emirates experienced a significant population increase in recent years as a result of major economic growth. This led to an influx of workers from diverse cultural and religious backgrounds, increasing the population from 4 million in 2004 to roughly 8 million in 2009. [5] As of 2020, foreigners represent 88.1% of the population, [6] the second largest proportion of expats in the world in relation to the nationals after the Vatican. As of 2015, the largest group of non-UAE nationals are South Asian 59.4% (Indians 38.2%, Bangladeshi 9.5%, Pakistani 9.4%, and others 2.3%), Egyptian 10.2%, Filipino 6.1%, and other 12.8%. [7]

Female citizens and non-citizens account for 28% percent of the UAE's population due to the high level of male foreign workers. [8] The majority of the UAE population falls in the age group of 25 to 54 year old. A large part of this can be attributed to the expatriate worker population who fall in the age category. [9] Population is heavily concentrated to the northeast on the Musandam Peninsula. The three largest Emirates (Dubai, Abu Dhabi, and Sharjah), are home to nearly 85% of the population. [10]

The 2022 population of the UAE stands at 9.4 million, [11] of which 69% of the population is male and 31% of the population is female. [12] [13] [14] The population density of the Emirates has reached a record 114 per km2. [15]

EmirateCensus 1975Census 1985Census 1995Census 2005Est. 2010
Abu Dhabi211,812566,036942,4631,399,484
Dubai183,187370,788689,4201,321,453
Sharjah78,790228,317402,792793,573
Ajman16,69054,546121,491206,997
Umm Al-Quwain6,90819,28535,36149,159
Ras Al-Khaimah43,84596,578143,334210,063
Fujairah16,65543,75376,180125,698
Total557,8871,379,3032,411,0414,106,4277,512,000 (UN) [16]
8,190,000 (NBS) [17]

Population pyramid data

UAE Census (05/12/2005)
Age groupMaleFemaleTotal%
Total2 806 1411 300 2864 106 427100
0-4145 601136 538282 1396.87
5-9139 929129 453269 3826.56
10-14130 778118 279249 0576.07
15-19121 388110 838232 2265.66
20-24272 036161 530433 56610.56
25-29483 657178 137661 79416.12
30-34489 879150 482640 36115.59
35-39386 762113 844500 60612.19
40-44262 71878 543341 2618.31
45-49174 45951 311225 7705.50
50-54107 33931 539138 8783.38
55-5951 30315 80467 1071.63
60-6418 8208 52727 3470.67
65-699 1725 28514 4570.35
70-745 3914 0139 4040.23
75-792 4401 8374 2770.10
80-841 5371 4392 9760.07
85+1 2501 1652 4150.06
unknown1 6821 7223 4040.08
Age groupMaleFemaleTotalPercent
0-14416 308384 270800 57819.50
15-642 366 679898 8333 265 51279.52
65+21 47215 46136 9330.90
[18]

Education and employment

There are more women (58%) in higher education than men.[ when? ] However, the unemployment rate for women is more than five times higher than it is for men. The most popular program is business which has the highest number of graduates, and the most second popular program is humanities and social science. [8]

Vital statistics

UN prospects

PeriodLive births per yearDeaths per yearNatural change per yearCBRCDRNCTFRIMR
1950–19554,0002,0002,00049.420.828.66.97175
1955–19604,0002,0003,00049.318.031.36.97156
1960–19655,0002,0004,00046.313.233.26.87120
1965–19708,0002,0006,00041.28.732.56.7777
1970–197512,0002,00010,00032.66.426.26.3651
1975–198023,0004,00019,00029.14.624.55.6636
1980–198536,0004,00032,00030.53.726.85.2325
1985–199045,0005,00040,00028.43.125.44.8317
1990–199548,0005,00042,00023.02.520.43.8812
1995–200049,0006,00043,00018.12.116.02.9710
2000–200557,0006,00051,00016.21.714.42.388
2005–201081,0008,00073,00014.01.412.61.867
CBR = crude birth rate (per 1000); CDR = crude death rate (per 1000); NC = natural change (per 1000); IMR = infant mortality rate per 1000 births; TFR = total fertility rate (number of children per woman)

Source: United National World Population Prospects [16]

Births and deaths

YearPopulationLive birthsDeathsNatural increaseCrude birth rateCrude death rateRate of natural increaseTFR
1976646,90021,39433.1
1977748,10023,11930.9
1978852,20027,64532.4
1979952,00031,68533.3
19801,042,00034,77433.4
19811,121,00038,54734.4
19821,190,00041,96135.3
19831,253,00043,41934.7
19841,318,00043,70433.2
19851,391,00044,19231.8
19861,472,00045,4603,22242,23830.92.228.7
19871,561,00047,7033,23144,47230.62.128.5
19881,656,00050,8363,44747,38930.72.128.6
19891,756,00051,9033,64048,26329.62.127.5
19901,860,00052,2643,93848,32628.12.126.0
19911,970,00049,4964,02645,47025.42.023.4
19922,087,00050,6044,27146,33324.22.022.2
19932,207,00050,1974,34245,85522.72.020.7
19942,329,00052,4404,58447,85622.52.020.5
19952,449,00048,5674,77943,78819.82.017.8
19962,571,00047,0504,78542,26518.31.916.4
19972,700,00046,3604,87841,48217.21.815.4
19982,838,00048,1365,03343,10317.01.815.2
19992,988,00049,6595,19444,46516.61.714.9
20003,155,00053,6865,39648,29017.01.715.3
20013,326,00056,1365,77750,35916.91.715.2
20023,507,00058,0705,99452,07516.61.714.9
20033,742,00061,1656,00255,16316.31.614.7
20044,088,00063,1136,12356,99015.41.513.9
20054,580,00064,6236,36158,26214.11.412.7
20065,242,00062,9606,48356,47712.01.210.8
20076,044,00067,6777,41460,26311.21.210.0
20086,894,00068,7797,75561,0249.91.18.8
20097,666,00076,3667,78968,57710.01.09.0
20108,271,00079,6257,41472,2119.60.98.7
20118,672,00083,9507,35076,6009.70.88.9
20128,900,00089,5787,70281,87610.10.99.2
20139,006,00093,5398,01588,52410.40.99.5
20149,071,00095,8608,26587,59510.60.99.7
20159,154,00097,3288,75588,57310.61.09.6
20169,121,20098,2998,98889,31110.81.09.8
20179,304,27797,7388,82688,91210.50.99.6
20189,366,82895,3098,79486,51510.20.99.3
20199,503,73894,6979,00685,69110.01.09.0
20209,282,41097,57210,35787,21510.51.19.4
202192,77711,91180,8669.71.28.5
202296,63111,76284,869

[19] [20]

Life expectancy

Life expectancy at birth in the United Arab Emirates Life expectancy in the United Arab Emirates.svg
Life expectancy at birth in the United Arab Emirates
PeriodLife expectancy in
Years
PeriodLife expectancy in
Years
1950–195543.91985–199070.7
1955–196049.61990–199572.2
1960–196554.71995–200073.6
1965–197059.62000–200574.8
1970–197563.42005–201075.9
1975–198066.42010–201576.7
1980–198568.8201978 [21]

Source: UN World Population Prospects [22]

Ethnic groups

The UAE National Bureau of Statistics does not publish demographic data in relation to any nationality. The figures listed in the table below are estimates provided by each country's embassy. [23]

Source: United Arab Emirates Population Statistics [24]

Estimate of the ethnicity of the population in UAE

   Indians (27.49%)
   Pakistanis (12.69%)
   Emiratis (11.48%)
   Bangladeshis (7.40%)
   Filipinos (5.56%)
   Iranians (4.76%)
   Egyptians (4.23%)
   Nepalese/Sri Lankans (3.17%)
  Chinese (2.11%)
  Others (38.55%)
Nationals ofPopulation % of total populationYear of data
Flag of India.svg  India 2,770,00027.49%2022
Flag of Pakistan.svg  Pakistan 1,280,00012.69%2022
Flag of the United Arab Emirates.svg  UAE 1,160,00011.48%2022
Flag of Bangladesh.svg  Bangladesh 750,0007.40%2022
Flag of the Philippines.svg  Philippines 560,0005.56%2022
Flag of Iran.svg  Iran*480,0004.76%2022
Flag of Egypt.svg  Egypt*430,0004.23%2022
Flag of Nepal.svg    Nepal 320,0003.17%2022
Flag of Sri Lanka.svg  Sri Lanka 320,0003.17%2022
Flag of Syria.svg  Syria 224,1182.21%2022
Flag of the United Kingdom.svg  United Kingdom 250,0002.61%2015
Flag of the People's Republic of China.svg  China 210,0002.11%2022
Flag of Jordan.svg  Jordan 200,0002.09%2015
Flag of the Taliban.svg  Afghanistan 150,0001.57%<2011
Flag of Palestine.svg  Palestine 150,0001.57%2009
Flag of Europe.svg  European Union 107,0001.09%2015
Flag of South Africa.svg  South Africa 100,0001.04%2014
Flag of Lebanon.svg  Lebanon*100,0001.04%2015
Flag of Ethiopia.svg  Ethiopia 90,0000.94%2014
Flag of Yemen.svg  Yemen 90,0000.94%2013
Flag of Indonesia.svg  Indonesia 85,0000.89%2015
Flag of Sudan.svg  Sudan 75,0000.78%2013
Flag of Saudi Arabia.svg  Saudi Arabia 70,0000.73%2014
Flag of Somalia.svg  Somalia 70,0000.73%2015
Flag of Iraq.svg  Iraq 52,0000.54%2014
Flag of the United States.svg  United States 50,0000.52%2015
Flag of Russia.svg  Russia 40,0000.42%2021
Flag of Canada (Pantone).svg  Canada 40,0000.42%2014
Flag of Kenya.svg  Kenya 40,0000.42%2014
Flag of Uganda.svg  Uganda 30,0000.32%2018
Flag of France.svg  France 25,0000.26%2015
Flag of Australia (converted).svg  Australia 16,0000.17%2015
Flag of Germany.svg  Germany 12,0000.12%2013
Flag of Spain.svg  Spain 12,0000.11%2015
Flag of Romania.svg  Romania 10,0000.10%2022
Flag of Algeria.svg  Algeria 10,0000.10%2014
Flag of Italy.svg  Italy 10,0000.10%2014
Flag of South Korea.svg  South Korea 10,0000.10%2014
Flag of Thailand.svg  Thailand 10,0000.10%2014
Flag of Turkey.svg  Turkey 10,0000.10%2014
Flag of Azerbaijan.svg  Azerbaijan 7,0000.07%2015
Flag of Ireland.svg  Ireland 7,0000.07%2015
Flag of Malaysia.svg  Malaysia 6,000 – 7,0000.06% – 0.07%2015
Flag of Colombia.svg  Colombia 5,4660.06%2018 [25]
Flag of Kazakhstan.svg  Kazakhstan 5,000 – 6,0000.05% – 0.06%2015
Flag of Greece.svg  Greece 5,0000.05%2015
Flag of Mauritania.svg  Mauritania 5,0000.05%2015
Flag of the Netherlands.svg  Netherlands 5,0000.05%2015
Flag of Serbia.svg  Serbia 5,0000.05%2015
Flag of Ukraine.svg  Ukraine 5,0000.05%2014
Flag of Sweden.svg  Sweden 4,0000.04%2015
Flag of Denmark.svg  Denmark 3,000 – 4,000≈0.03%2015
Flag of Mexico.svg  Mexico 3,000 – 3,500≈0.03%2014
Flag of Belgium (civil).svg  Belgium 3,0000.03%2015
Flag of Eritrea.svg  Eritrea 3,0000.03%2015
Flag of Japan.svg  Japan 2,603≈0.03%2015
Flag of the Dominican Republic.svg  Dominican Republic 2,000-3,0000.02% – 0.03%2015
Flag of Austria.svg  Austria 2,500≈0.03%2015
Flag of Belarus.svg  Belarus 2,500≈0.03%2015
Flag of Hungary.svg  Hungary 2,500≈0.03%2015
Flag of Switzerland (Pantone).svg   Switzerland 2,430≈0.03%2013
Flag of Poland.svg  Poland 2,348≈0.02%2015
Flag of Singapore.svg  Singapore >2,000≈0.02%2015
Flag of Bosnia and Herzegovina.svg  Bosnia and Herzegovina 1,000 – 2,0000.01% – 0.02%2015
Flag of the Czech Republic.svg  Czech Republic 1,500≈0.02%2015
Flag of Venezuela.svg  Venezuela 1,200≈0.01%2015
Flag of Norway.svg  Norway 1,184≈0.01%2015
Flag of Finland.svg  Finland 1,180≈0.01%2014
Flag of Cyprus.svg  Cyprus 1,000≈0.01%2014
Flag of Slovakia.svg  Slovakia 1,000≈0.01%2014
Flag of Senegal.svg  Senegal 700 – 800< 0.01%2015
Flag of Ghana.svg  Ghana 500< 0.01%2015
Flag of New Zealand.svg  New Zealand 444< 0.01%2015
Flag of the Republic of China.svg  Taiwan 400< 0.01%2015
Flag of Latvia.svg  Latvia 300< 0.01%2014
Flag of Peru.svg  Peru 300< 0.01%2015
Flag of Chile.svg  Chile 270< 0.01%2014
Flag of Albania.svg  Albania 200 – 300< 0.01%2015
Flag of Chad.svg  Chad 200< 0.01%2015
Flag of Slovenia.svg  Slovenia 100 – 150< 0.01%2015
Flag of Angola.svg  Angola 100< 0.01%2015
Flag of Zimbabwe.svg  Zimbabwe 1< 0.001%2018
Flag of Nigeria.svg  Nigeria 1> 0.001%2020

*The figures for the countries cannot be directly sourced to embassy statements.

The UAE population is made of Emirati nationals (11.6%), other Arab and Iranian nationalities (18%), South Asian nationalities (59%) and other expatriate nationalities (includes Westerners, East Asians and Africans) at 12%).[ citation needed ]

Languages

A multilingual (Arabic, English, Urdu) signboard in the UAE UAE signboard.jpg
A multilingual (Arabic, English, Urdu) signboard in the UAE
Most spoken languages in the UAE (>100k users) [26]
LanguageNumber of speakers (all users)
Gulf Arabic 3,480,000
Modern Standard Arabic 3,090,000
Malayalam 1,060,000
South Levantine Arabic 499,000
Tamil 455,000
Northern Pashto 379,000
Southern Balochi 379,000
Hejazi Arabic 370,000
Bengali 337,000
Tagalog 303,000
Omani Arabic 303,000
Iranian Persian 303,000
Egyptian Arabic 284,000
French language 250,000
Eastern Punjabi 201,000
Southern Pashto 144,000
North Levantine Arabic 127,000
Sinhala 121,000
Sindhi 102,000

Although Arabic is the official language, the most used language is English. English is also the main medium of instruction at all levels of schooling. [27]

Emirati people speak Gulf Arabic. [28] The Achomi language (Persian dialect) is also spoken by a 303,000 people in the UAE. [29] [30]

Other languages spoken in the UAE, due to immigration, include other Arabic dialects (such as Levantine Arabic), Malayalam (1,060,000 speakers in the UAE [30] ), Hindi–Urdu, Marathi, Persian, Cebuano, Pashto (144,000 speakers in the UAE [30] ), Kannada, Bengali (337,000 speakers in the UAE [30] ), Punjabi (201,000 speakers in the UAE [30] ), Odia, Telugu, Baluchi and Southern Baluchi (379,000 speakers in the UAE [30] ), Sinhala (121,000 speakers in the UAE [30] ), Russian, Ukrainian, Somali, Tagalog (303,000 speakers in the UAE [30] ), Nepali, Mandarin, Tamil (455,000 speakers in the UAE [30] ), Spanish, Italian and Greek.

In 2019, Abu Dhabi included Hindi as third official court language. [31] [32] Currently, the UAE government provides lectures and tests to obtain a driving license in Urdu, Hindi, Malayalam, Tamil and Bengali, besides Arabic and English. [33]

Religions

Religion in the United Arab Emirates (2020 estimate) [34]

   Islam (Official) (74.5%)
   Christianity (12.9%)
   Hinduism (6.2%)
   Buddhism (3.2%)
   Agnosticism (1.3%)
  Others (1.9%)
Islam is the majority and official religion in the United Arab Emirates, professed by 74.5% of the population as of 2020. 63.3% are Sunni, 6.7% are Shia, while 4.4% follow another branch of Islam. [34] The Al Nahyan and Al Maktoum ruling families adhere to the Maliki school of jurisprudence. Many followers of the Hanbali school are found in Sharjah, Umm al-Quwain, Ras al-Khaimah and Ajman. [35] Their followers include the Al Qasimi ruling family. The other main religions present in the country include Christianity (12.9%), Hinduism (6.2%), and Buddhism (3.2%). [34] Zoroastrians, Druze, Baha'i, Judaism, and Sikhism are also practiced by some non-nationals. [36] 1.3% of the population is agnostic. [34]

See also

Related Research Articles

Politics of the United Arab Emirates take place in a framework of a federal presidential elective constitutional monarchy. The United Arab Emirates (UAE) is a federation of seven constituent monarchies: the Emirates of Abu Dhabi, Ajman, Dubai, Fujairah, Ras al-Khaimah, Sharjah, and Umm al-Quwain.

<span class="mw-page-title-main">Economy of the United Arab Emirates</span>

The United Arab Emirates is a high-income developing market economy. The UAE's economy is the 4th largest in the Middle East, with a gross domestic product (GDP) of US$415 billion in 2021-2023.

<span class="mw-page-title-main">United Arab Emirates</span> Country in West Asia

The United Arab Emirates (UAE), or simply the Emirates, is a country in West Asia, in the Middle East. Located at the eastern end of the Arabian Peninsula, it shares borders with Oman and Saudi Arabia; as well as maritime borders in the Persian Gulf with Qatar and Iran. The United Arab Emirates is an elective monarchy formed from a federation of seven emirates. As of 2023, the UAE has an estimated population of 9.97 million. Emirati citizens are estimated to form 11.6% of the population; the remaining residents are expatriates, the majority of whom are South Asian. Islam is the official religion and Arabic is the official language. Abu Dhabi is the country's capital, while Dubai, the most populous city, is an international hub.

<span class="mw-page-title-main">Hinduism in the United Arab Emirates</span> Overview of the presence, role and impact of Hinduism in United Arab Emirates

Hindus are the third largest Religious group in the United Arab Emirates and constitute around 6.6%-15% of the population in the nation. Hinduism is followed mainly by the significant Nepali and Indian population in the United Arab Emirates.

Private education in Dubai is regulated by the Knowledge and Human Development Authority. The UAE Ministry of Education is responsible for public schools in Dubai. Currently, more than 90% of school education in Dubai takes place in the private sector, served by 194 private schools offering 17 different curricula to more than 280,000 students from 182 nationalities. Dubai has 26 international branch campuses of universities from 12 different countries - including the UK, Australia and India. More than 30,000 students attend these universities, with the majority studying business, engineering and media & design. The Knowledge and Human Development Authority (KHDA) was founded in 2006 to develop education and human resource sectors in Dubai, and license educational institutes.

<span class="mw-page-title-main">Emiratis</span> Native Arab population of the United Arab Emirates

The Emiratis are the native citizen population of the United Arab Emirates. Within the UAE itself, they number approximately 1.15 million.

Provision of education in the UAE began shortly after the establishment of the federation with the inception of the first university in Al Ain, Abu Dhabi, the United Arab Emirates University. Since then, the country has progressed with efforts of ensuring high literacy rates, modern programs and women's share in education. It works on improving its youths education which is why the agenda 2021 has been set. The UAE currently devotes approximately 25 percent of total federal government spending to education. As of 2019, the overall literacy rate is 96%.

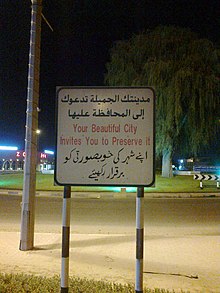
Mass media in the United Arab Emirates is subject to government control and censorship. Media freedom is severely curtailed in the UAE. Most UAE media is owned by the government or by groups that have ties to the government. UAE law permits the government to censor content critical of the government. Journalists and writers who criticize the government are subject to repression.

<span class="mw-page-title-main">Emirati passport</span> Passport of the United Arab Emirates issued to Emirati citizens

Emirati passports are passports given from the government of the United Arab Emirates (UAE) to Emirati citizens for the purpose of international travel.

<span class="mw-page-title-main">Emirati cuisine</span> Culinary traditions of the United Arab Emirates

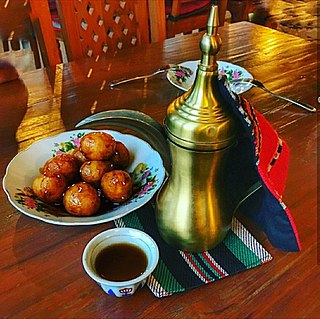
Emirati cuisine is the local traditional Arabic cuisine of the United Arab Emirates. It is part of Eastern Arabian cuisine and shares similarities with cuisines from neighboring countries, such as Omani cuisine and Saudi Arabian cuisine, as well as influences from different Middle Eastern and Asian cuisines.

<span class="mw-page-title-main">Culture of the United Arab Emirates</span>

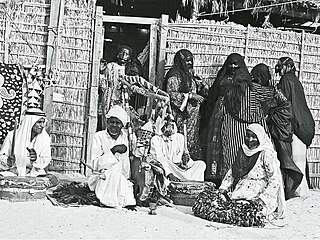
The culture of the United Arab Emirates is part of the culture of Eastern Arabia. Its historical population was a small tribal community that changed with the arrival of an influx of foreign nationals in the mid-20th century. Emirati culture is a blend of Arabian, Islamic, and Persian cultures, with influences from the cultures of East Africa and Indian Subcontinent. Islam has had a prominent influence on local architecture, music, attire, cuisine, and lifestyle.

Pakistanis in the United Arab Emirates include expatriates from Pakistan who have settled in the United Arab Emirates (UAE), With a population of over 1.5 million, Pakistanis are the second largest national group in the UAE after Indians, constituting 12.5% of the country's total population. They are the third largest overseas Pakistani community, behind the Pakistani diaspora in Saudi Arabia and the United Kingdom. The population is diverse and consists of people from all over Pakistan, including Punjab, Sindh, Khyber Pakhtunkhwa and FATA, Balochistan, Azad Kashmir and Gilgit Baltistan. The majority of Pakistanis are Muslim, with significant minorities of Christians, Hindus and other religions. The majority are found in Dubai and Abu Dhabi respectively, while a significant population is spread out in Sharjah and the remaining Northern Emirates. Dubai alone accounts for a Pakistani population of 400,000.

Americans in the United Arab Emirates are residents of the United Arab Emirates (UAE) who originate from the United States. As of 2015, there are over 50,000 Americans living in the country.

Iraqis in the United Arab Emirates have a population exceeding 200,000, closer estimates report a total of 250,000 Iraqis in the Emirates. Since its independence, Iraqis have contributed in the development of UAE, as engineers, politicians and in other fields. Most notably Adnan Pachachi who was appointed as Minister of State in the first Government of the Emirate of Abu Dhabi. Pachachi is known for his role in submitting the UAE's application for membership in the United Nations. In a meeting with Prime Minister of Iraq, Mustafa Al-Kadhimi, Mohamed bin Zayed Al Nahyan stated that "Iraqis have contributed in building the UAE, and there are many of them who worked, built, developed and helped build the Emirates, and we mention this credit to them, whether engineers, doctors, or even politicians and others. There are still many Iraqis living in the UAE, and they are credited.”

<span class="mw-page-title-main">Emirati Americans</span> Ethnic group

Emirati Americans are Americans who have roots, origin, and descent from the United Arab Emirates.

Expatriates in the United Arab Emirates represent about 88% of the population, while Emiratis constitute roughly 12% of the total population, making the UAE home to one of the world's highest percentage of expatriates.

<span class="mw-page-title-main">Emirati Arabic</span> Arabic varieties of the UAE

EmiratiArabic refers to a group of Arabic dialectal varieties spoken by the Emiratis native to the United Arab Emirates that share core characteristics with specific phonological, lexical, and morphosyntactic features and a certain degree of intra-dialectal variation, which is mostly geographically defined. It incorporates grammatical properties of smaller varieties within the UAE, generally of tribal nature, which can be roughly divided into a couple of broader sub-varieties: the first spoken in the Northern Emirates of Dubai, Sharjah, Ajman, Umm al-Quwain, and the western part of Ras al-Khaimah; the second in the eastern part of the country, mainly in Fujeirah, Dibba, Khor Fakkan, Hatta, Kalba, and the eastern part of Ras al-Khaimah; the third in Abu Dhabi including the oasis city of Al Ain, the dialect is also seen in the Omani region of Al-Buraimi. Emirati Arabic varieties can also be distinguished based on environmental factors, including variations associated with Bedouin communities, coastal, agricultural, and mountainous regions.

<span class="mw-page-title-main">Poland–United Arab Emirates relations</span> Bilateral relations

Polish-Emirati relations are foreign relations between the Republic of Poland and the United Arab Emirates. Poland has an embassy in Abu Dhabi, and the United Arab Emirates has its counterpart in Warsaw.

<span class="mw-page-title-main">Afro-Emiratis</span> Ethnic group

Afro-Emiratis, also known as African Emiratis and Black Emiratis, are Emiratis of full or partial Black African and Afro-Arab descent. They are mostly concentrated in the Northern Emirates. Despite their minority status within the broader Emirati population, they have a significant historical presence and cultural contribution, especially in sports and music.

References

  1. 1 2 "Population (Total)". World Bank.
  2. "United Arab Emirates Population (2018)". www.worldometers.info.
  3. "UAE National Bureau of Statistics" (PDF). Archived from the original (PDF) on 8 October 2013.
  4. "United Arab Emirates". World Gazetteer.[ dead link ]
  5. "World Bank Open Data". World Bank Open Data. Retrieved 2024-05-14.
  6. "International Migration 2020 Highlights" (PDF). United Nations Department of Economic and Social Affairs, Population Division. 2020.
  7. "The World Factbook — Central Intelligence Agency". www.cia.gov. Retrieved 2018-05-15.
  8. 1 2 Kemp, Linzi J. (2013). "Progress in female education and employment in the United Arab Emirates towards Millennium Development Goal (3): gender equality". Foresight. 15 (4): 264–277. doi:10.1108/fs-02-2012-0007.
  9. "UAE Population Statistics in 2018 (Infographics) | GMI". Official GMI Blog. Retrieved 2018-05-15.
  10. "United Arab Emirates", The World Factbook, Central Intelligence Agency, 2024-05-07, retrieved 2024-05-14
  11. "World Bank Open Data". World Bank Open Data. Retrieved 2024-05-14.
  12. "Population and demographic mix - The Official Portal of the UAE Government". u.ae. Retrieved 2023-03-08.
  13. "UAE Population Statistics 2022-2023". Digital Gravity. 2022-09-23. Retrieved 2023-03-08.
  14. "UAE demographics 2021 - StatisticsTimes.com". statisticstimes.com. Retrieved 2023-03-08.
  15. "United Arab Emirates Population (2024) - Worldometer". www.worldometers.info. Retrieved 2024-02-14.
  16. 1 2 "World Population Prospects - Population Division - United Nations". esa.un.org. Archived from the original on 2011-05-07. Retrieved 2012-03-22.
  17. "Population leaps to 8.19 million". UAE Interact. May 30, 2010. Archived from the original on February 12, 2015. Retrieved February 11, 2015.
  18. "Demographic Yearbook". UN Data. United Nations. Retrieved 4 December 2015.
  19. "United Nations Statistics Division - Demographic and Social Statistics". unstats.un.org.
  20. "Population". Federal Competitivness and Statistics Authority. Archived from the original on 12 April 2021. Retrieved 7 March 2020.
  21. "Geoba.se: Gazetteer - the World - Life Expectancy - Top 100+ by Country (2021)".
  22. "World Population Prospects – Population Division – United Nations". Archived from the original on 2016-09-19. Retrieved 2017-07-15.
  23. Snoj, Jure (April 12, 2015). "UAE´s population - by nationality". bq Magazine. Archived from the original on March 21, 2017. Retrieved February 28, 2017.
  24. "World Population Prospects – Population Division – United Nations" . Retrieved 2022-03-18.
  25. "Elecciones Presidencia de la República".
  26. United Arab Emirates, Ethnologue
  27. Hopkyns, Sarah (2020-11-29), "Multilingualism and linguistic hybridity in Dubai", Multilingual Global Cities, Routledge, pp. 248–264, doi:10.4324/9780429463860-17, ISBN   9780429463860, S2CID   228826552 , retrieved 2022-11-06
  28. Christensen, Shane (2010). Frommer's Dubai. John Wiley & Sons. p. 174. ISBN   978-0470711781.
  29. "Lari language".
  30. 1 2 3 4 5 6 7 8 9 United Arab Emirates, on Ethnologue
  31. Abu Dhabi includes Hindi as third official court language
  32. UAE introduces Hindi as third official language
  33. Not about numbers: Why Abu Dhabi labour court chose Hindi over Malayalam
  34. 1 2 3 4 "United Arab Emirates". cia.gov. Retrieved 19 February 2023.
  35. Barry Rubin (2010), Guide to Islamist Movements, Volume 2, ME Sharpe, ISBN   978-0765617477, p. 310
  36. US State Dept 2022 report