Dow Jones Global Titans 50

Last updated
Dow Jones Global Titans 50
10-Year Price Trend of Dow Jones Global Titans 50 Index (USD).svg
Foundation1992
Operator S&P Dow Jones Indices
Trading symbol.DJGT
Constituents55
Market cap Increase2.svg USD$230,709.11 million
Weighting methodModified Market Cap Weighted
Related indices Dow Jones Industrial Average
Website https://www.spglobal.com/spdji/en/indices/equity/dow-jones-global-titans-50-index/#overview
Reuters .DJGT

The Dow Jones Global Titans 50 index is a float-adjusted index of 50 of the largest (by market capitalization) and best known blue chip companies traded on the New York Stock Exchange, American Stock Exchange, Nasdaq, Euronext, London Stock Exchange, and Tokyo Stock Exchange. The index represents the biggest and most liquid stocks traded in individual countries. It was created by Dow Jones Indexes to reflect the globalization of international blue chip securities in the wake of mergers and the creation of megacorporations.

Contents

The DJ Global Titans 50 is part of the Dow Jones Global Titans Indexes. They are large cap companies with at least some of their operations outside of their domestic markets. Each index is constructed by selecting stocks from the corresponding benchmark indexes of the Dow Jones Global Indexes. [1]

Dow Jones also offers the Dow Jones Sector Titans Indexes, which are global indexes covering large-cap stocks in sectors such as financial services, chemicals, industrial goods and services, energy, consumer goods, and noncyclical goods and services.

Statistics

As of July 19, 2019 the DJ Global Titans 50 had a total market capitalization valued at US$230,709.11 [2] million and a total return of 15.23 percent over the last three years. [1]

Composition

As of March 2022, there are 55 constituents that make up the DJGT, this is caused by certain companies, like Alphabet, having multiple constituents within the index.

Dow Jones Global Titans 50 Components [3]
CountryCorporation Ticker Industry
Flag of the United States.svg  United States 3M NYSE :  MMM Industrial Goods
Flag of the United States.svg  United States AbbVie Inc. NYSE :  ABBV Pharmaceutical
Flag of Germany.svg  Germany Allianz FWB :  ALV Insurance
Flag of the United States.svg  United States Alphabet Nasdaq :  GOOG; Nasdaq :  GOOGL Technology
Flag of the United States.svg  United States Amazon Nasdaq :  AMZN Technology
Flag of the United States.svg  United States Amgen Nasdaq :  AMGN Pharmaceutical
Flag of Belgium (civil).svg  Belgium Anheuser-Busch InBev Euronext :  ABI Beverage
Flag of the United States.svg  United States Apple Nasdaq :  AAPL Technology
Flag of Australia (converted).svg  Australia BHP ASX :  BHP Metals
Flag of the United States.svg  United States The Boeing Company NYSE :  BA Aerospace
Flag of the United Kingdom.svg  United Kingdom BP LSE :  BP Oil & Gas
Flag of the United Kingdom.svg  United Kingdom British American Tobacco LSE :  BATS Tobacco
Flag of the United States.svg  United States Chevron Corporation NYSE :  CVX Energy
Flag of the United States.svg  United States Cisco Systems Nasdaq :  CSCO Technology
Flag of the United States.svg  United States Citigroup NYSE :  C Banking
Flag of the United States.svg  United States Coca-Cola NYSE :  KO Food & Beverage
Flag of the United States.svg  United States DuPont NYSE :  DD Chemicals
Flag of the United States.svg  United States ExxonMobil NYSE :  XOM Energy
Flag of the United States.svg  United States Meta Nasdaq :  FB Technology
Flag of the United States.svg  United States General Electric NYSE :  GE Conglomerate
Flag of the United Kingdom.svg  United Kingdom GlaxoSmithKline LSE :  GSK Pharmaceutical
Flag of the United Kingdom.svg  United Kingdom HSBC LSE :  HSBA Banking
Flag of the United States.svg  United States Intel Nasdaq :  INTC Technology
Flag of the United States.svg  United States IBM NYSE :  IBM Technology
Flag of the United States.svg  United States Johnson & Johnson NYSE :  JNJ Pharmaceutical
Flag of the United States.svg  United States JPMorgan Chase NYSE :  JPM Banking
Flag of the United States.svg  United States Mastercard NYSE :  MA Banking
Flag of the United States.svg  United States McDonald's NYSE :  MCD Restaurant
Flag of the United States.svg  United States Merck & Co. NYSE :  MRK Pharmaceutical
Flag of the United States.svg  United States Microsoft Nasdaq :  MSFT Technology
Flag of Switzerland (Pantone).svg   Switzerland Nestlé SIX :  NESN Food & Beverage
Flag of Switzerland (Pantone).svg   Switzerland Novartis NYSE :  NOVN Pharmaceutical
Flag of the United States.svg  United States Nvidia Nasdaq :  NVDA Technology
Flag of the United States.svg  United States Oracle Corporation NYSE :  ORCL Technology
Flag of the United States.svg  United States PepsiCo Nasdaq :  PEP Food & Beverage
Flag of the United States.svg  United States Pfizer NYSE :  PFE Health Care
Flag of the United States.svg  United States Philip Morris International NYSE :  PM Tobacco
Flag of the United States.svg  United States Procter & Gamble NYSE :  PG Consumer Goods
Flag of Switzerland (Pantone).svg   Switzerland Roche SIX :  ROG Health Care
Flag of Canada (Pantone).svg  Canada Royal Bank of Canada TSX :  RY Banking
Flag of the United Kingdom.svg  United Kingdom Royal Dutch Shell Euronext :  RDSA Oil & Gas
Flag of South Korea.svg  South Korea Samsung Electronics LSE :  SMSN Conglomerate
Flag of France.svg  France Sanofi Euronext :  SAN Pharmaceutical
Flag of Germany.svg  Germany Siemens FWB :  SIE Conglomerate
Flag of the Republic of China.svg  Taiwan Taiwan Semiconductor NYSE :  TSM Technology
Flag of France.svg  France TotalEnergies Euronext :  TOT Energy
Flag of the United States.svg  United States Visa NYSE :  V Banking
Flag of Japan.svg  Japan Toyota TYO : 7203 Automobiles & Parts
Flag of the United States.svg  United States Walmart NYSE :  WMT Retail
Flag of the United States.svg  United States The Walt Disney Company NYSE :  DIS Entertainment

See also

Related Research Articles

Passive management is an investing strategy that tracks a market-weighted index or portfolio. Passive management is most common on the equity market, where index funds track a stock market index, but it is becoming more common in other investment types, including bonds, commodities and hedge funds.

<span class="mw-page-title-main">Dow Jones Industrial Average</span> American stock market index composed of 30 industry leaders

The Dow Jones Industrial Average (DJIA), Dow Jones, or simply the Dow, is a stock market index of 30 prominent companies listed on stock exchanges in the United States.

<span class="mw-page-title-main">S&P 500</span> American stock market index

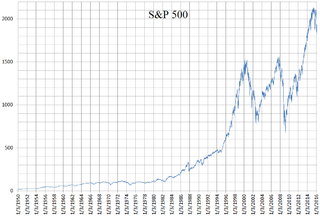
The Standard and Poor's 500, or simply the S&P 500, is a stock market index tracking the stock performance of 500 of the largest companies listed on stock exchanges in the United States. It is one of the most commonly followed equity indices and includes approximately 80% of the total market capitalization of U.S. public companies.

<span class="mw-page-title-main">KOSPI</span> Korean stock market index

The Korea Composite Stock Price Index or KOSPI (Korean: 한국종합주가지수) is the index of all common stocks traded on the Stock Market Division—previously, Korea Stock Exchange—of the Korea Exchange. It is the representative stock market index of South Korea, analogous to the S&P 500 in the United States.

<span class="mw-page-title-main">S&P/TSX Composite Index</span> Canadian stock market index

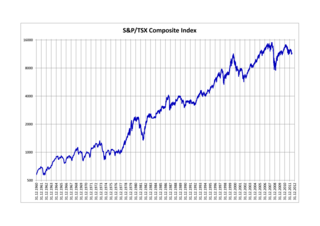
The S&P/TSX Composite Index is the benchmark Canadian index representing roughly 70% of the total market capitalization on the Toronto Stock Exchange (TSX). Having replaced the TSE 300 Composite Index on May 1, 2002, as of September 20, 2021 the S&P/TSX Composite Index comprises 237 of the 3,451 companies listed on the TSX. The index reached an all-time closing high of 21,768.53 on November 12, 2021 and an intraday record high of 21,796.16 on November 16, 2021.

The S&P Global 100 Index is a stock market index of global stocks from Standard & Poor's.

The S&P/ASX 50 Index is a stock market index of Australian stocks listed on the Australian Securities Exchange from Standard & Poor's.

The S&P Latin America 40 is a stock market index from Standard & Poor's. It tracks Latin American stocks.

The S&P 100 Index is a stock market index of United States stocks maintained by Standard & Poor's.

<span class="mw-page-title-main">Indonesia Stock Exchange</span> Stock exchange

Indonesia Stock Exchange (IDX) is a stock exchange based in Jakarta, Indonesia. It was previously known as the Jakarta Stock Exchange (JSX) before its name changed in 2007 after merging with the Surabaya Stock Exchange (SSX). In recent years, the Indonesian Stock Exchange has seen the fastest membership growth in Asia. As of 2023, the Indonesia Stock Exchange had 833 listed companies, and total stock investors were about 6.4 million, compared to 2.5 million at the end of 2019. Indonesia Market Capitalization accounted for 45.2% of its nominal GDP in December 2020. Founded on 30 November 2007, it is ASEAN's largest market capitalization at US$744 billion as of 15 December 2023.

The Russian Industrial Leaders Index (RUXX) is a composite index of Russian companies traded on global exchanges. The RUXX is calculated by Dow Jones & Company and managed by Press Release Group and RIA Novosti, the Russian State Information Agency.

The Dow Jones Global Indexes (DJGI) is a family of international equity indexes, including world, region, and country indexes and economic sector, market sector, industry-group, and subgroup indexes created by Dow Jones Indexes a unit of Dow Jones & Company best known for the Dow Jones Industrial Average.

SPDR funds are a family of exchange-traded funds (ETFs) traded in the United States, Europe, Mexico and Asia-Pacific and managed by State Street Global Advisors (SSGA). Informally, they are also known as Spyders or Spiders. SPDR is a trademark of Standard and Poor's Financial Services LLC, a subsidiary of S&P Global. The name is an acronym for the first member of the family, the Standard & Poor's Depositary Receipts, now the SPDR S&P 500 Trust ETF, which is designed to track the S&P 500 stock market index.

The S&P/ASX 20 index is a stock market index of stocks listed on the Australian Securities Exchange from Standard & Poor's. While the "ASX 20" often simply refers to the 20 largest companies by market capitalisation, the S&P/ASX 20 Index is calculated by using the S&P Dow Jones Indices market capitalization weighted and float-adjusted methodologies. All 20 companies also feature in the S&P/ASX 50.

The S&P/ASX 300, or simply, ASX 300, is a stock market index of Australian stocks listed on the Australian Securities Exchange (ASX). The index is market-capitalisation weighted, meaning each company included is in proportion to the indexes total market value, and float-adjusted, meaning the index only considers shares available to public investors.

The S&P MidCap 400 Index, more commonly known as the S&P 400, is a stock market index from S&P Dow Jones Indices.

<span class="mw-page-title-main">Stock market index</span> Financial metric which investors use to determine market performance

In finance, a stock index, or stock market index, is an index that measures the performance of a stock market, or of a subset of a stock market. It helps investors compare current stock price levels with past prices to calculate market performance.

<span class="mw-page-title-main">Hang Seng Index</span> Stock market index in Hong Kong

The Hang Seng Index (HSI) is a freefloat-adjusted market-capitalization-weighted stock-market index in Hong Kong. It is used to record and monitor daily changes of the largest companies of the Hong Kong stock market and is the main indicator of the overall market performance in Hong Kong. These 82 constituent companies represent about 58% of the capitalisation of the Hong Kong Stock Exchange.

VN30 Equal Weight Index tracks the total performance of the top 30 large-cap, liquid stocks listed on the Ho Chi Minh City stock exchange along with two popular indices in Vietnam: VN Index and VN30 Index. All index constituents are equal-weighted to help investors deal with liquidity, foreign ownership and state-owned enterprise constraints when investing in Vietnam.

References

  1. 1 2 "Dow Jones Global Titans 50™ Index Fact Sheet" (PDF). Archived from the original (PDF) on 2015-02-18. Retrieved 2015-02-18.
  2. "Dow Jones Global Titans 50 Index (USD) - S&P Dow Jones Indices". us.spindices.com. Retrieved 2019-07-21.
  3. "Dow Jones Global Titans, 28". www.ftportfolios.com. Retrieved 2019-07-21.