Economic relations of Japan

Last updated

In its economic relations, Japan is both a major trading nation and one of the largest international investors in the world. In many respects, international trade is the lifeblood of Japan's economy. Imports and exports totaling the equivalent of nearly US$1.309.2 Trillion in 2017, which meant that Japan was the world's fourth largest trading nation after China, the United States and Germany. Trade was once the primary form of Japan's international economic relationships, but in the 1980s its rapidly rising foreign investments added a new and increasingly important dimension, broadening the horizons of Japanese businesses and giving Japan new world prominence. [1]

Contents

Postwar development

Japan's international economic relations in the first three decades after World War II were shaped largely by two factors: a relative lack of domestic raw materials and a determination to catch up with the industrial nations of the West. Its exports have consisted exclusively of manufactured goods, and raw materials have represented a large share of its imports. The country's sense of dependency and vulnerability has also been strong because of its lack of raw materials. Japan's determination to catch up with the West encouraged policies to move away from simple labor-intensive exports toward more sophisticated export products (from textiles in the 1950s to automobiles and consumer electronics in the 1980s) and to pursue protectionist policies to limit foreign competition for domestic industries. [1]

After the end of the World War II, Japan's economy was in a shambles, with production in 1945 at 10% of prewar levels. Its international economic relations were almost completely disrupted. Initially, imports were limited to essential food and raw materials, mostly financed by economic assistance from the United States. Because of extreme domestic shortages, exports did not begin to recover until the Korean War (1950–53), when special procurement by United States armed forces created boom conditions in indigenous industries. By 1954 economic recovery and rehabilitation were essentially complete. For much of the 1950s, however, Japan had difficulty exporting as much as it imported, leading to chronic trade and current account deficits. Keeping these deficits under control, so that Japan would not be forced to devalue its currency under the Bretton Woods system of fixed exchange rates that prevailed at the time, was a primary concern of government officials. Stiff quotas and tariffs on imports were part of the policy response. By 1960 Japan accounted for 3.6 percent of all exports of noncommunist countries. [1]

1960s

During the 1960s, the U.S. dollar value of exports grew at an average annual rate of 16.9 percent, more than 75 percent faster than the average rate of all noncommunist countries. By 1970 exports had risen to nearly 6.9 percent of all noncommunist-world exports. The rapid productivity growth in manufacturing industries made Japanese products more competitive in world markets at the fixed exchange rate for the yen during the decade, and the chronic deficits that the nation faced in the 1950s had disappeared by the middle of the 1970s. International pressure to dismantle quota and tariff barriers mounted, and Japan began moving in this direction. The pressure also allowed the United States to grow even further economically. [1]

1970s

The 1970s began with the end of the fixed exchange rate for the yen (a change brought about mainly by rapidly rising Japanese trade and current account surpluses) and with a strong rise in the value of the yen under the new system of floating rates. The sense of dependence on imported raw materials grew strong, when crude petroleum and other material prices rose during the 1973 oil crisis and supply was uncertain. Japan faced sharply higher bills for imports of energy and other raw materials. The new exchange rates and the rise in raw material prices meant that the surpluses of the decade's beginning were lost, and large trade deficits followed in the wake of the second oil price shock in 1979. Expanding the country's exports remained a priority in the face of these raw material supply shocks, and during the decade exports continued to expand at a high annual average rate of 21 percent. [1]

1980s

During the 1980s, however, raw material prices fell and the feeling of vulnerability lessened. The 1980s also brought rapidly rising trade surpluses, so that Japan could export far more than was needed to balance its imports. In response to these surpluses, the value of the yen rose against that of other currencies in the last half of the decade, but the surpluses proved surprisingly resilient to this change. With these developments, some of the resistance to manufactured imports, long considered luxuries in the relative absence of raw materials, began to dissipate. Japan had caught up. Now an advanced industrial nation, it faced new changes in its economy, on both domestic and international fronts, including demands to supply more foreign aid and to open its markets for imports. It had become a leader in the international economic system through its success in certain export markets, its leading technologies, and its growth as a major investor around the world. These were epochal changes for Japan, after a century in which the main national motivation was to catch up with the West. These dramatic changes also fed domestic developments that were lessening the society's insularity and parochialism. The large surpluses, combined with foreign perceptions that Japan's import markets were still relatively closed, exacerbated tension between Japan and a number of its principal trading partners, especially the United States. A rapid increase in imports of manufactured goods after 1987 eased some of these tensions, but as the decade ended, friction still continued. [1]

The processes through which Japan is becoming a key member of the international economic community continued into the 1990s. Productivity continued to grow at a healthy pace, the country's international leadership in a number of industries remained unquestioned, and investments abroad continued to expand. Pressures were likely to lead to further openness to imports, increased aid to foreign countries, and involvement in the running of major international institutions, such as the International Monetary Fund (IMF). As Japan achieved a more prominent international position during the 1980s, it also generated considerable tension with its trade partners, especially with the United States, [1] although these have dissipated more recently as the growth of Japans economy has slowed. The largest blow to these trade tensions was Japan's prolonged economic crisis in the 1990s known as the Lost Decade.

Foreign investment

Through most of the postwar period foreign investment was not a significant part of Japan's external economic relations. Both domestic and foreign investments were carefully controlled by government regulations, which kept the investment flows small. These controls applied to direct investment in the creation of subsidiaries under the control of a parent company, portfolio investment, and lending. Controls were motivated by the desire to prevent foreigners (mainly Americans) from gaining ownership of the economy when Japan was in a weak position after World War II, and by concerns over the balance of payments deficits. Beginning in the late 1960s, these controls were gradually loosened, and the process of deregulationn accelerated and continued throughout the 1980s. The result was a dramatic increase in capital movements, with the biggest change occurring in outflows—investments by Japanese in other countries. By the end of the 1980s, Japan had become a major international investor. Because the country was a newcomer to the world of overseas investment, this development led to new forms of tension with other countries, including criticism of highly visible Japanese acquisitions in the United States and elsewhere. [1]

Relations by region

Asia

The developing nations of Asia grew very rapidly as suppliers to and buyers from Japan. In 1990 these sources (including South Korea, Taiwan, Hong Kong, Singapore, Indonesia, and other countries in Southeast Asia) accounted for 28.8 percent of Japan's exports, a share well below the 34 percent value of 1960 but one that had been roughly constant since 1970. In 1990 developing Asian countries provided 23 percent of Japan's imports, a share that had risen slowly from 16 percent in 1970. [1]

As a whole, Japan had run a surplus with noncommunist Asia, and this surplus rose quickly in the 1980s. From a minor deficit in 1980 of US$841 million (mostly caused by a peak in the value of oil imports from Indonesia), Japan showed a surplus of nearly US$3 billion with these countries in 1985 and of over US$228 billion in 1990. The shift was caused by the fall in the prices of oil and other raw materials that Japan imported from the region and by the rapid growth in Japanese exports as the region's economic growth continued at a high rate. [1]

Indonesia and Malaysia both continued to show a trade surplus because of their heavy raw material exports to Japan. However, falling oil prices caused trade in both directions between Japan and Indonesia to decline in the 1980s. Trade similarly declined with the Philippines, owing to the political turmoil and economic contraction there in the 1980s. [1]

South Korea, Taiwan, Hong Kong, and Singapore constituted the newly industrialized economies (NIEs) in Asia, and all four exhibited high economic growth during the 1970s and 1980s. Like Japan, they lacked many raw materials and mainly exported manufactured goods. Their deficits with Japan increased from 1980 to 1988, when the deficits of all four were sizeable. Over the 1970s and 1980s, they evolved a pattern of importing components from Japan and exporting assembled products to the United States. [1]

Japan's direct investment in Asia also expanded with the total cumulative value reaching over US$32 billion by 1988. Indonesia, at US$9.8 billion in 1988, was the largest single location for these investments. As rapid as the growth of investment was, however, it did not keep pace with Japan's global investment, so Asia 's share in total cumulative investment slipped, from 26.5 percent in 1975 to 17.3 percent in 1988. [1]

China is now Japan's largest export market, surpassing the U.S. despite a drop in overall trade, according to recent figures from the Japan External Trade Organization. Japan's exports to China fell 25.3% during the first half of 2009 to $46.5 billion, but due to a steeper drop in shipments to the U.S., China became Japan's largest trade destination for the first time. China is also Japan's largest source of imports.

Middle East

The importance of the Middle East expanded dramatically in the 1970s with the jumps in crude oil prices. The 1973 oil crisis put a break to the high rates of economic growth Japan enjoyed in the 1960s, and Japan was deeply concerned with maintaining good relations with these oil-producing nations to avoid a debilitating cut in oil supplies. During the 1980s, however, oil prices fell and Japan's concerns over the security of its oil supply diminished greatly. [1] Still, measures were taken to reduce Japanese dependency on oil as energy source. After the end of the Cold War, Japan tried to win Russia as another source of oil, but so far Japanese–Russian relations remain tense because of territorial disputes. Other oil sources include Indonesia and Venezuela.

The Middle East represented only 7.5 percent of total Japanese imports in 1960 and 12.4 percent in 1970, with the small rise resulting from the rapid increase in the volume of oil consumed by the growing Japanese economy. By 1980, however, this share had climbed to a peak of 31.7 percent because of the two rounds of price hikes in the 1970s. Falling oil prices after 1980 brought this share back down to 10.5 percent by 1988—actually a lower percentage than in 1970, before the price hikes had started. The major oil suppliers to Japan in 1988 were Saudi Arabia and the United Arab Emirates. Iran, Iraq, and Kuwait were also significant, but smaller, sources. These three countries became less important oil suppliers after 1980 because of the Iran–Iraq War (1980–1988), [1] Iraq's invasion of Kuwait in 1990, UN sanctions and the 2003 US invasion of Iraq.

As imports from the Middle East surged in the 1970s, so did Japan's exports to the region. Paralleling the pattern for imports, however, this share fell in the 1980s. Amounting to 1.8 percent in 1960, exports to this region rose to 11.1 percent of total Japanese exports in 1980 but then declined to 3.6 percent by 1988. [1]

Part of Japan's strategy to ensure oil supplies is to encourage investment in oil-supplying countries. However, such investment have never kept pace with Japan's investments in other regions. The country's expanding need for oil helped push direct investment in the Middle East to 9.3 percent of total direct investments abroad by Japanese companies in 1970, but this share had fallen to 6.2 percent by 1980 and to only 1.8 percent by 1988. The Iran–Iraq War (1980–88) was a major factor in the declining interest of Japanese investors, exemplified by the fate of a large US$3 billion petrochemical complex in Iran, which was almost complete when the Islamic revolution took place in Iran in 1979. Completion was delayed first by political concerns (when United States embassy personnel were held hostage) and then by repeated Iraqi bombing raids. The project was finally canceled in 1989, with losses for both Japanese companies and the Japanese government, which had provided insurance for the project. [1]

In the 1990s, urbanization in several Gulf states, especially Dubai, led to a number of profitable contracts for Japanese construction companies.

Western Europe

Japan's trade with Western Europe grew steadily but had been relatively small well into the 1980s considering the size of this market. In 1980 Western Europe supplied only 7.4 percent of Japan's imports and took 16.6 percent of its exports. However, the relationship began to change very rapidly after 1985. West European exports to Japan increased two and one-half times in just the three years from 1985 to 1988 and rose as a share of all Japanese imports to 16 percent. (Much of this increase came from growing Japanese interest in West European consumer items, including luxury automobiles.) Likewise, Japan's exports to Western Europe rose rapidly after 1985, more than doubling by 1988 and accounting for 21 percent of all Japan's exports. [1] By 1990 Western Europe's share of Japan's imports had risen to 18 percent and the share of Japan's exports that it received had risen to 22 percent.

In 1990 the major European buyers of Japanese exports were West Germany (US$17.7 billion) and Britain (US$10.7 billion). The largest European suppliers to Japan were West Germany (US$11.5 billion), France (US$7.6 billion), and Britain (US$5.2 billion). Traditionally, West European countries had trade deficits with Japan, and this continued to be the case in 1988, despite the surge in Japan's imports from them after 1985. From 1980 to 1988, the deficit of the West European countries as a whole expanded from US$11 billion to US$25 billion, with much of the increase coming after 1985. [1] That diminished somewhat to US$20.7 billion in 1990, before rising sharply to US$34 billion in 1992.

Trade relations with Western Europe were strained during the 1980s. Policies varied among the individual countries, but many imposed restrictions on Japanese imports. Late in the decade, as discussions proceeded on the trade and investment policies that were expected to prevail with European economic integration in 1992, many Japanese officials and business people became concerned that protectionism directed against Japan would increase. Domestic content requirements (specifying the share of local products and value added in a product) and requirements on the location of research and development facilities and manufacturing investments appeared likely. [1]

Fear of a protectionist Western Europe accelerated Japanese direct investment in the second half of the 1980s. Total accumulated Japanese direct investments in the region grew from US$4.5 billion in 1980 to over US$30 billion in 1988, from 12.2 percent to more than 16 percent of such Japanese investments. Rather than being discouraged by protectionist signals from Europe, Japanese businesses appeared to be determined to play a significant role in what promises to be a large, vigorous, and integrated market. Investment offered the surest means of circumventing protectionism, and Japanese business appeared to be willing to comply with whatever domestic content or other performance requirements the European Union might impose. [1]

Latin America

In the 1970s, Japan briefly showed enthusiasm over Brazilian prospects. A vast territory richly endowed with raw materials and with a sizable Japanese-Brazilian minority in the population, Brazil appeared to Japanese business to offer great opportunities for trade and investment. However, none of those expectations have been realized, and Japanese financial institutions became caught up in the international debt problems of Brazil and other Latin American countries. [1]

In 1990 Japan received US$9.8 billion of imports from Latin America as a whole and exported US$10.2 billion to the region, for a surplus of US$429 million. Although the absolute value of both exports and imports had grown over time, Latin America had declined in importance as a Japanese trading partner. The share of Japan's total imports coming from this region dropped from 7.3 percent in 1970 to 4.1 percent in 1980, remaining at 4.2 percent in 1990. Japan's exports to Latin America also declined, from 6.9 percent in 1980 to 3.6 percent in 1990. [1]

Despite this relative decline in trade, Japan's direct investment in the region continued to grow quickly, reaching US$31.6 billion in 1988, or 16.9 percent of Japan's total foreign direct investment. This share was only slightly below that of 1975 (18.1 percent) and was almost equal to the share in Asian countries. However, over US$11 billion of this investment was in Panama—mainly for Panamanian-flag shipping, which does not represent true investment in the country. The Bahamas also attracted US$1.9 billion in investment, mainly from Japanese financial institutions but also in arrangements to secure favorable tax treatment rather than real investments. Brazil absorbed US$5 billion in Japanese direct investment, Mexico absorbed US$1.6 billion, and other Latin American countries absorbed amounts below US$1 billion in the late 1980s. [1]

Latin American countries lie at the heart of the Third World debt problems that plagued international financial relations in the 1980s. Japanese financial institutions became involved as lenders to these nations, although they were far less exposed than United States banks. Because of this financial involvement, the Japanese government was actively involved in international discussions of how to resolve the crisis. In 1987 Minister of Finance Miyazawa Kiichi put forth a proposal on resolving the debt issue. Although that initiative did not go through, the Brady Plan that emerged in 1989 contained some elements of the Miyazawa Plan. The Japanese government supported the Brady Plan by pledging US$10 billion in cofinancing with the World Bank and the IMF. [1]

Japan has signed a Free Trade Agreement with Mexico.

International Trade and Development Institutions

Japan is a member of the United Nations (UN), the International Monetary Fund (IMF), the Organisation for Economic Co-operation and Development (OECD), and the General Agreement on Tariffs and Trade (GATT). It also participates in the international organizations focusing on economic development, including the World Bank and the Asian Development Bank. [1]

As a member of the IMF and World Bank, for example, Japan played a role in the effort during the 1980s to address the international debt crisis brought on by the inability of certain developing countries to service their foreign debts as raw material prices fell and their economies stagnated. As a member of the IMF, Japan also cooperates with other countries in moderating the shortrun volatility of the yen and participates in discussions on strengthening the international monetary system. [1]

Japan's membership in the OECD has constrained its foreign economic policy to some extent. When Japan joined the OECD in 1966, it was obliged to agree to OECD principles on capital liberalization, an obligation that led Japan to begin the process of liberalizing its many tight controls on investment flows into and out of Japan. Japan is also a participant in the OECD's "gentlemen's agreement" on guidelines for government-supported export credits, which places a floor on interest rates and other terms for loans to developing countries from government-sponsored export-import banks. [1]

GATT has provided the basic structure through which Japan has negotiated detailed international agreements on import and export policies. Although Japan had been a member of GATT since 1955, it retained reservations to some GATT articles, permitting it to keep in place stiff quota restrictions until the early 1960s. Japan took its GATT obligations seriously, however, and a number of American disputes with Japan over its import barriers were successfully resolved by obtaining GATT rulings, with which Japan complied. Japan also negotiated bilaterally with countries on economic matters of mutual interest. [1]

The international organization with the strongest Japanese presence has been the Asian Development Bank, the multilateral lending agency established in 1966 that made soft loans to developing Asian countries. Japan and the United States have had the largest voting rights in the Asian Development Bank, and Japan has traditionally filled the presidency. [1]

As Japan became a greater international financial power in the 1980s, its role in financing these trade and development institutions grew. Previously, the government had been a quiet participant in these organizations, but as its financial role increased, pressure to expand voting rights and play a more active policy role mounted. [1]

By the early 1990s, Japan's influence and voting rights in the World Bank and IMF and other multilateral development banks increased. Japan's financial and policy positions become more prominent. Tokyo had assumed a leading role at the Asian Development Bank for a number of years. At the World Bank, Japan's voting share represented about 9.4 percent, compared with 16.3 percent for the United States. Japan also made several "special" contributions to particular World Bank programs that raised its financial status but did not alter its voting position. Japan planned to participate in the East European Development Bank, making a contribution of 8.5 percent, the same as the United States and major West European donors. Japan also displayed a growing prominence in IMF deliberations, helping ease the massive debt burdens of developing countries, and generally supported efforts in the early 1990s at the GATT Uruguay Round of trade negotiations to liberalize world trade and investment. [1]

List of the largest trading partners of Japan

These figures do not include services or foreign direct investment, but only trade in goods. The fifteen largest Japanese trading partners with their total trade (sum of imports and exports) in billions of US Dollars for calendar year 2017 are as follows: [2]

RankCountry/DistrictExportsImportsTotal TradeTrade Balance
-

World

697.2670.91,368.1
1Flag of the People's Republic of China.svg  China 132.651164.256296.907-31.605
-Infobox ASEAN flag.svg  ASEAN 105.719102.773208.4922.946
2Flag of the United States.svg  United States 134.59572.038206.63362.557
-Flag of Europe.svg  European Union 77.10877.984155.092-0.876
3Flag of South Korea.svg  South Korea 53.20628.06081.26625.146
4Flag of the Republic of China.svg  Taiwan 40.58825.36065.94815.228
5Flag of Australia (converted).svg  Australia 15.99338.86554.858-22.872
6Flag of Thailand.svg  Thailand 29.39522.70652.1016.689
7Flag of Germany.svg  Germany 18.92323.40642.329-4.483
8Flag of Hong Kong.svg  Hong Kong 35.3991.71337.11233.686
9Flag of Vietnam.svg  Vietnam 15.03818.51133.549-3.473
10Flag of Indonesia.svg  Indonesia 13.37819.85433.232-6.476
11Flag of Malaysia.svg  Malaysia 12.74519.23531.98-6.49
12Flag of Singapore.svg  Singapore 22.6118.51731.12814.094
13Flag of the United Arab Emirates.svg  United Arab Emirates 7.20220.72227.924-13.52
Flag of the CIS.svg  CIS 7.27915.76323.042-8.484
14Flag of the Philippines.svg  Philippines 11.1149.76220.8761.352
15Flag of the United Kingdom.svg  United Kingdom 13.7107.06120.7716.649

Japan is also the dominant export partner of the following:

Exports [3]
RegionPercentage
Flag of Brunei.svg  Brunei 36.5%
Flag of French Polynesia.svg  French Polynesia 22.2%
Flag of the Philippines.svg  Philippines 20.8%
Flag of Qatar.svg  Qatar 20.0%

See also

Bibliography

Related Research Articles

Economy of Armenia National economy

The Armenian economy contracted sharply in 2020, by 5.7%, mainly due to the 2020 Armenia-Azerbaijan war. In contrast it grew by 7.6 per cent in 2019, the largest recorded growth since 2007, while between 2012 and 2018 GDP grew 40.7%, and key banking indicators like assets and credit exposures almost doubled.

Economy of Bulgaria National economy of the Republic of Bulgaria

The economy of Bulgaria functions on the principles of the free market, having a large private sector and a smaller public one. Bulgaria is an industrialised high-income country according to the World Bank, and is a member of the European Union (EU), the World Trade Organization (WTO), the Organization for Security and Co-operation in Europe (OSCE) and the Organization of the Black Sea Economic Cooperation (BSEC). The Bulgarian economy has experienced significant growth (538%), starting from $13.15 billion and reaching estimated gross domestic product (GDP) of $86 billion or $203 billion, GDP per capita of $31,148, average gross monthly salary of 1,771 leva, and average net monthly salary of $1,838 (2021). The national currency is the lev, pegged to the euro at a rate of 1.95583 leva for 1 euro. The lev is the strongest and most stable currency in Eastern Europe.

Balance of trade Difference between the monetary value of exports and imports

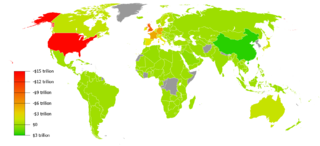
The balance of trade, commercial balance, or net exports, is the difference between the monetary value of a nation's exports and imports over a certain time period. Sometimes a distinction is made between a balance of trade for goods versus one for services. The balance of trade measures a flow of exports and imports over a given period of time. The notion of the balance of trade does not mean that exports and imports are "in balance" with each other.

Economy of Indonesia National economy

The economy of Indonesia is the largest in Southeast Asia and is one of the emerging market economies. As a middle income country & member of the G20, Indonesia is classified as a newly industrialized country. It is the 17th largest economy in the world by nominal GDP and the 7th largest in terms of GDP (PPP). Estimated at US$40 billion in 2019, Indonesia's Internet economy is expected to cross the US$130 billion mark by 2025. Indonesia depends on domestic market and government budget spending and its ownership of state-owned enterprises. The administration of prices of a range of basic goods also plays a significant role in Indonesia's market economy. However, since the 1990s, the majority of the economy has been controlled by individual Indonesians and foreign companies.

Economy of Nicaragua National economy

The economy of Nicaragua is focused primarily on the agricultural sector. Nicaragua itself is the least developed country in Central America, and the second poorest in the Americas by nominal GDP. In recent years, under the administrations of Daniel Ortega, the Nicaraguan economy has expanded somewhat, following the Great Recession, when the country's economy actually contracted by 1.5%, due to decreased export demand in the American and Central American markets, lower commodity prices for key agricultural exports, and low remittance growth. The economy saw 4.5% growth in 2010 thanks to a recovery in export demand and growth in its tourism industry. Nicaragua's economy continues to post growth, with preliminary indicators showing the Nicaraguan economy growing an additional 5% in 2011. Consumer Price inflation have also curtailed since 2008, when Nicaragua's inflation rate hovered at 19.82%. In 2009 and 2010, the country posted lower inflation rates, 3.68% and 5.45%, respectively. Remittances are a major source of income, equivalent to 15% of the country's GDP, which originate primarily from Costa Rica, the United States, and European Union member states. Approximately one million Nicaraguans contribute to the remittance sector of the economy.

Economy of Paraguay Economy of the country

The economy of Paraguay is a market economy that is highly dependent on agriculture products. In recent years, Paraguay's economy has grown as a result of increased agricultural exports, especially soybeans. Paraguay has the economic advantages of a young population and vast hydroelectric power. Its disadvantages include the few available mineral resources, and political instability. The government welcomes foreign investment.

Economy of Yemen National economy of Yemen

The economy of Yemen is one of the poorest and least-developed in the world. At the time of unification, South Yemen and North Yemen had vastly different but equally struggling underdeveloped economic systems. Since unification, the economy has been forced to sustain the consequences of Yemen's support for Iraq during the 1990–91 Persian Gulf War: Saudi Arabia expelled almost 1 million Yemeni workers, and both Saudi Arabia and Kuwait significantly reduced economic aid to Yemen. The 1994 civil war further drained Yemen's economy. As a consequence, Yemen has relied heavily on aid from multilateral agencies to sustain its economy for the past 24 years. In return, it has pledged to implement significant economic reforms. In 1997 the International Monetary Fund (IMF) approved two programs to increase Yemen's credit significantly: the enhanced structural adjustment facility and the extended funding facility (EFF). In the ensuing years, Yemen's government attempted to implement recommended reforms: reducing the civil service payroll, eliminating diesel and other subsidies, lowering defense spending, introducing a general sales tax, and privatizing state-run industries. However, limited progress led the IMF to suspend funding between 1999 and 2001.

Balance of payments Difference between the inflow and outflow of money to a country at a given time

In international economics, the balance of payments of a country is the difference between all money flowing into the country in a particular period of time and the outflow of money to the rest of the world. These financial transactions are made by individuals, firms and government bodies to compare receipts and payments arising out of trade of goods and services.

Trade policy of Japan Overview of the trade policy of Japan

The trade policy of Japan related to Japan's approach to import and export with other countries.

In its balance of payments accounts, Japan has traditionally run a deficit in services. Trade in services includes transportation, insurance, travel expenditures, royalties, licensing fees, and income from investments. The deficit in services rose steadily from US$99 million in 1960, to nearly US$1.8 billion in 1970 and to more than US$11.3 billion in 1980 which can be attributed to rising royalty and licensing payments for Japan's acquisition of technology from other industrial countries and to rising deficits in the trade-related services of transportation and insurance. The transportation deficit rose after the 1960s, as rapidly climbing labor costs made Japanese-flag vessels less competitive, leading to greater use of foreign-flag carriers.

Capital began to flow in and out of Japan following the Meiji Restoration of 1868, but policy restricted loans from overseas. In the aftermath of World War II, Japan was a debtor nation until the mid-1960s. Subsequently, capital controls were progressively removed, in part as a result of agreements with the United States. This process led to rapid expansion of capital flows during the 1970s and especially the 1980s, when Japan became a creditor nation and the largest net investor in the world. This credit position resulted both from foreign direct investment by Japanese corporations, and portfolio investment. In particular, the rapid increase of Japan's direct investments overseas, much exceeding foreign investment in Japan, led to some tension with the US at the end of the 1980s.

Economic history of Turkey Overview of the economic history of the Republic of Turkey

The economic history of the Republic of Turkey may be studied according to sub-periods signified with major changes in economic policy:

  1. 1923–1929, when development policy emphasised private accumulation;
  2. 1929–1945, when development policy emphasised state accumulation in a period of global crises;
  3. 1950–1980, a period of state guided industrialisation based on import substituting protectionism;
  4. 1980 onwards, opening of the Turkish economy to liberal trade in goods, services and financial market transactions.
Foreign trade of the Soviet Union Overview of foreign trade in the Soviet Union

Soviet foreign trade played only a minor role in the Soviet economy. In 1985, for example, exports and imports each accounted for only 4 percent of the Soviet gross national product. The Soviet Union maintained this low level because it could draw upon a large energy and raw material base, and because it historically had pursued a policy of self-sufficiency. Other foreign economic activity included economic aid programs, which primarily benefited the less developed Council for Mutual Economic Assistance (COMECON) countries of Cuba, Mongolia, and Vietnam.

Trade is a key factor of the economy of China. In the three decades following the formation of the Communist Chinese state in 1949, China's trade institutions at first developed into a partially modern but somewhat inefficient system. The drive to modernize the economy that began in 1978 required a sharp acceleration in commodity flows and greatly improved efficiency in economic transactions. In the ensuing years economic reforms were adopted by the government to develop a socialist market economy. This type of economy combined central planning with market mechanisms. The changes resulted in the decentralization and expansion of domestic and foreign trade institutions, as well as a greatly enlarged role for free market in the distribution of goods, and a prominent role for foreign trade and investment in economic development.

Economy of Algeria National economy of Algeria

The economy of Algeria expanded by 1.4% in 2018, up from 4.1% in 2016 with growth driven mainly by the recovering oil and gas sector.

Foreign trade of the United States Overview of foreign trade in the United States of America

Foreign trade of the United States comprises the international imports and exports of the United States. The country is among the top three global importers and exporters.

The economic history of Ecuador covers the period of the economy of Ecuador in Ecuadoran history beginning with colonization by the Spanish Empire, through independence and up to modern-day.

Economy of Argentina National economy of Argentina

Argentina is a developing country. Its economy is the second-largest national economy in South America, behind Brazil.

This article is intended to give an overview of the trade policy of South Korea. In 1945 Korea was liberated from the Empire of Japan at the end of World War II. A destructive drought in 1958 forced Korea to import large amounts of food grains. In 1950, the Korean war broke out, which destroyed more than two-thirds of the nation's production facilities and most of its infrastructure. Trade policy of South Korea has taken many shifts, from import substitution to globalization and there has been significant impact on the economy for the same.

This article is about the foreign trade of Sudan.

References

  1. 1 2 3 4 5 6 7 8 9 10 11 12 13 14 15 16 17 18 19 20 21 22 23 24 25 26 27 28 29 30 31 32 Dolan, Ronald E; Worden, Robert L., eds. (1992). Japan: A Country Study (Fifth ed.). Washington: Federal Research Division, Library of Congress. ISBN   0-8444-0731-3.PD-icon.svg This article incorporates public domain material from this U.S government document.
  2. "Japanese Trade and Investment Statistics | Reports and Statistics - Japan External Trade Organization - JETRO". www.jetro.go.jp. Retrieved 2018-07-13.
  3. "The World Factbook — Central Intelligence Agency". Archived from the original on 2018-02-12. Retrieved 2012-07-19.