In mathematics, a total or linear order is a partial order in which any two elements are comparable. That is, a total order is a binary relation on some set , which satisfies the following for all and in :
- (reflexive).
- If and then (transitive).
- If and then (antisymmetric).
- or .

In mathematics, a monotonic function is a function between ordered sets that preserves or reverses the given order. This concept first arose in calculus, and was later generalized to the more abstract setting of order theory.

A citation is a reference to a source. More precisely, a citation is an abbreviated alphanumeric expression embedded in the body of an intellectual work that denotes an entry in the bibliographic references section of the work for the purpose of acknowledging the relevance of the works of others to the topic of discussion at the spot where the citation appears.
In mathematics, there are several equivalent ways of defining the real numbers. One of them is that they form a complete ordered field that does not contain any smaller complete ordered field. Such a definition does not prove that such a complete ordered field exists, and the existence proof consists of constructing a mathematical structure that satisfies the definition.
The impact factor (IF) or journal impact factor (JIF) of an academic journal is a scientometric index calculated by Clarivate that reflects the yearly mean number of citations of articles published in the last two years in a given journal, as indexed by Clarivate's Web of Science. As a journal-level metric, it is frequently used as a proxy for the relative importance of a journal within its field; journals with higher impact factor values are given the status of being more important, or carry more prestige in their respective fields, than those with lower values. While frequently used by universities and funding bodies to decide on promotion and research proposals, it has come under attack for distorting good scientific practices.
Scientometrics is the field of study which concerns itself with measuring and analysing scholarly literature. Scientometrics is a sub-field of informetrics. Major research issues include the measurement of the impact of research papers and academic journals, the understanding of scientific citations, and the use of such measurements in policy and management contexts. In practice there is a significant overlap between scientometrics and other scientific fields such as information systems, information science, science of science policy, sociology of science, and metascience. Critics have argued that over-reliance on scientometrics has created a system of perverse incentives, producing a publish or perish environment that leads to low-quality research.
Citation analysis is the examination of the frequency, patterns, and graphs of citations in documents. It uses the directed graph of citations — links from one document to another document — to reveal properties of the documents. A typical aim would be to identify the most important documents in a collection. A classic example is that of the citations between academic articles and books. For another example, judges of law support their judgements by referring back to judgements made in earlier cases. An additional example is provided by patents which contain prior art, citation of earlier patents relevant to the current claim.

Google Scholar is a freely accessible web search engine that indexes the full text or metadata of scholarly literature across an array of publishing formats and disciplines. Released in beta in November 2004, the Google Scholar index includes peer-reviewed online academic journals and books, conference papers, theses and dissertations, preprints, abstracts, technical reports, and other scholarly literature, including court opinions and patents.
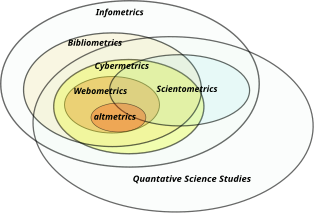
Informetrics is the study of quantitative aspects of information, it is an extension and evolution of traditional bibliometrics and scientometrics. Informetrics uses bibliometrics and scientometrics methods to study mainly the problems of literature information management and evaluation of science and technology. Informetrics is an independent discipline that uses quantitative methods from mathematics and statistics to study the process, phenomena, and law of informetrics. Informetrics has gained more attention as it is a common scientific method for academic evaluation, research hotspots in discipline, and trend analysis.
Citation impact is a measure of how many times an academic journal article or book or author is cited by other articles, books or authors. Citation counts are interpreted as measures of the impact or influence of academic work and have given rise to the field of bibliometrics or scientometrics, specializing in the study of patterns of academic impact through citation analysis. The journal impact factor, the two-year average ratio of citations to articles published, is a measure of the importance of journals. It is used by academic institutions in decisions about academic tenure, promotion and hiring, and hence also used by authors in deciding which journal to publish in. Citation-like measures are also used in other fields that do ranking, such as Google's PageRank algorithm, software metrics, college and university rankings, and business performance indicators.
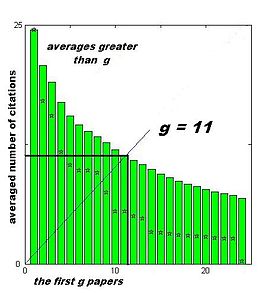
The h-index is an author-level metric that measures both the productivity and citation impact of the publications, initially used for an individual scientist or scholar. The h-index correlates with obvious success indicators such as winning the Nobel Prize, being accepted for research fellowships and holding positions at top universities. The index is based on the set of the scientist's most cited papers and the number of citations that they have received in other publications. The index has more recently been applied to the productivity and impact of a scholarly journal as well as a group of scientists, such as a department or university or country. The index was suggested in 2005 by Jorge E. Hirsch, a physicist at UC San Diego, as a tool for determining theoretical physicists' relative quality and is sometimes called the Hirsch index or Hirsch number.
Journal ranking is widely used in academic circles in the evaluation of an academic journal's impact and quality. Journal rankings are intended to reflect the place of a journal within its field, the relative difficulty of being published in that journal, and the prestige associated with it. They have been introduced as official research evaluation tools in several countries.
Academic authorship of journal articles, books, and other original works is a means by which academics communicate the results of their scholarly work, establish priority for their discoveries, and build their reputation among their peers.
The Shapley–Shubik power index was formulated by Lloyd Shapley and Martin Shubik in 1954 to measure the powers of players in a voting game. The index often reveals surprising power distribution that is not obvious on the surface.
In mathematics and social science, a collaboration graph is a graph modeling some social network where the vertices represent participants of that network and where two distinct participants are joined by an edge whenever there is a collaborative relationship between them of a particular kind. Collaboration graphs are used to measure the closeness of collaborative relationships between the participants of the network.
Scholar indices are used to measure the contributions of scholars to their fields of research. Since the 2005 paper of Jorge E. Hirsch, the use of scholar indices has increased.

Scientific collaboration network is a social network where nodes are scientists and links are co-authorships as the latter is one of the most well documented forms of scientific collaboration. It is an undirected, scale-free network where the degree distribution follows a power law with an exponential cutoff – most authors are sparsely connected while a few authors are intensively connected. The network has an assortative nature – hubs tend to link to other hubs and low-degree nodes tend to link to low-degree nodes. Assortativity is not structural, meaning that it is not a consequence of the degree distribution, but it is generated by some process that governs the network’s evolution.
Author-level metrics are citation metrics that measure the bibliometric impact of individual authors, researchers, academics, and scholars. Many metrics have been developed that take into account varying numbers of factors.

Ronald Rousseau is a Belgian mathematician and information scientist. He has obtained an international reputation for his research on indicators and citation analysis in the fields of bibliometrics and scientometrics.
Attention inequality is a term used to denote the inequality of distribution of attention across users on social networks, people in general, and for scientific papers. Yun Family Foundation introduced "Attention Inequality Coefficient" as a measure of inequality in attention and arguments it by the close interconnection with wealth inequality.