Analysis of variance (ANOVA) is a collection of statistical models and their associated estimation procedures used to analyze the differences among means. ANOVA was developed by the statistician Ronald Fisher. ANOVA is based on the law of total variance, where the observed variance in a particular variable is partitioned into components attributable to different sources of variation. In its simplest form, ANOVA provides a statistical test of whether two or more population means are equal, and therefore generalizes the t-test beyond two means. In other words, the ANOVA is used to test the difference between two or more means.

In statistics, an estimator is a rule for calculating an estimate of a given quantity based on observed data: thus the rule, the quantity of interest and its result are distinguished. For example, the sample mean is a commonly used estimator of the population mean.
Multivariate statistics is a subdivision of statistics encompassing the simultaneous observation and analysis of more than one outcome variable, i.e., multivariate random variables. Multivariate statistics concerns understanding the different aims and background of each of the different forms of multivariate analysis, and how they relate to each other. The practical application of multivariate statistics to a particular problem may involve several types of univariate and multivariate analyses in order to understand the relationships between variables and their relevance to the problem being studied.

Statistics is the discipline that concerns the collection, organization, analysis, interpretation, and presentation of data. In applying statistics to a scientific, industrial, or social problem, it is conventional to begin with a statistical population or a statistical model to be studied. Populations can be diverse groups of people or objects such as "all people living in a country" or "every atom composing a crystal". Statistics deals with every aspect of data, including the planning of data collection in terms of the design of surveys and experiments.

A statistical hypothesis test is a method of statistical inference used to decide whether the data sufficiently support a particular hypothesis. A statistical hypothesis test typically involves a calculation of a test statistic. Then a decision is made, either by comparing the test statistic to a critical value or equivalently by evaluating a p-value computed from the test statistic. Roughly 100 specialized statistical tests have been defined.
Accuracy and precision are two measures of observational error. Accuracy is how close a given set of measurements are to their true value, while precision is how close the measurements are to each other.
In statistics, the likelihood-ratio test assesses the goodness of fit of two competing statistical models, specifically one found by maximization over the entire parameter space and another found after imposing some constraint, based on the ratio of their likelihoods. If the constraint is supported by the observed data, the two likelihoods should not differ by more than sampling error. Thus the likelihood-ratio test tests whether this ratio is significantly different from one, or equivalently whether its natural logarithm is significantly different from zero.

Marie-Esprit-Léon Walras was a French mathematical economist and Georgist. He formulated the marginal theory of value and pioneered the development of general equilibrium theory. Walras is best known for his book Éléments d'économie politique pure, a work that has contributed greatly to the mathematization of economics through the concept of general equilibrium. The definition of the role of the entrepreneur found in it was also taken up and amplified by Joseph Schumpeter.
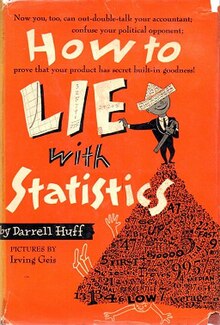
Darrell Huff was an American writer, and is best known as the author of How to Lie with Statistics (1954), the best-selling statistics book of the second half of the twentieth century.

Wilhelm Lexis, full name Wilhelm Hector Richard Albrecht Lexis, was a German statistician, economist, and social scientist. The Oxford Dictionary of Statistics cites him as a "pioneer of the analysis of demographic time series". Lexis is largely remembered for two items that bear his name—the Lexis ratio and the Lexis diagram.

A pie chart is a circular statistical graphic which is divided into slices to illustrate numerical proportion. In a pie chart, the arc length of each slice is proportional to the quantity it represents. While it is named for its resemblance to a pie which has been sliced, there are variations on the way it can be presented. The earliest known pie chart is generally credited to William Playfair's Statistical Breviary of 1801.
False precision occurs when numerical data are presented in a manner that implies better precision than is justified; since precision is a limit to accuracy, this often leads to overconfidence in the accuracy, named precision bias.
Statistics, when used in a misleading fashion, can trick the casual observer into believing something other than what the data shows. That is, a misuse of statistics occurs when a statistical argument asserts a falsehood. In some cases, the misuse may be accidental. In others, it is purposeful and for the gain of the perpetrator. When the statistical reason involved is false or misapplied, this constitutes a statistical fallacy.
Cohen's kappa coefficient is a statistic that is used to measure inter-rater reliability for qualitative (categorical) items. It is generally thought to be a more robust measure than simple percent agreement calculation, as κ takes into account the possibility of the agreement occurring by chance. There is controversy surrounding Cohen's kappa due to the difficulty in interpreting indices of agreement. Some researchers have suggested that it is conceptually simpler to evaluate disagreement between items.
In statistics, the number of degrees of freedom is the number of values in the final calculation of a statistic that are free to vary.
In statistics and applications of statistics, normalization can have a range of meanings. In the simplest cases, normalization of ratings means adjusting values measured on different scales to a notionally common scale, often prior to averaging. In more complicated cases, normalization may refer to more sophisticated adjustments where the intention is to bring the entire probability distributions of adjusted values into alignment. In the case of normalization of scores in educational assessment, there may be an intention to align distributions to a normal distribution. A different approach to normalization of probability distributions is quantile normalization, where the quantiles of the different measures are brought into alignment.
In metrology, measurement uncertainty is the expression of the statistical dispersion of the values attributed to a measured quantity. All measurements are subject to uncertainty and a measurement result is complete only when it is accompanied by a statement of the associated uncertainty, such as the standard deviation. By international agreement, this uncertainty has a probabilistic basis and reflects incomplete knowledge of the quantity value. It is a non-negative parameter.
Statistical literacy is the ability to understand and reason with statistics and data. The abilities to understand and reason with data, or arguments that use data, are necessary for citizens to understand material presented in publications such as newspapers, television, and the Internet. However, scientists also need to develop statistical literacy so that they can both produce rigorous and reproducible research and consume it. Numeracy is an element of being statistically literate and in some models of statistical literacy, or for some populations, it is a prerequisite skill. Being statistically literate is sometimes taken to include having the abilities to both critically evaluate statistical material and appreciate the relevance of statistically-based approaches to all aspects of life in general or to the evaluating, design, and/or production of scientific work.
Irving Geis was an American artist who worked closely with biologists. Geis's hand-drawn work depicts many structures of biological macromolecules, such as DNA and proteins, including the first crystal structure of sperm whale myoglobin.

In statistics, a misleading graph, also known as a distorted graph, is a graph that misrepresents data, constituting a misuse of statistics and with the result that an incorrect conclusion may be derived from it.