| Illinois's 24th congressional district | |
|---|---|
| Obsolete district | |
| Created | 1900 |
| Eliminated | 1980 |
| Years active | 1903-1983 |
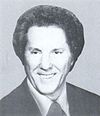
The 24th congressional district of Illinois was a congressional district for the United States House of Representatives in Illinois. It was eliminated as a result of the redistricting cycle after the 1980 census. It was last represented by Paul Simon who was redistricted into the 22nd district.
| Party | Candidate | Votes | % | ±% | |
|---|---|---|---|---|---|
| Democratic | Paul Simon (incumbent) | 112,134 | 49.12 | -16.51% | |
| Republican | John T. Anderson | 110,176 | 48.26 | +13.89% | |
| Constitution Party of Illinois | James H. Barrett | 5,985 | 2.62 | N/A | |
| Write-in | 1 | 0.00 | N/A | ||
| Total votes | 228,296 | 100.0 | |||
| Party | Candidate | Votes | % | ±% | |
|---|---|---|---|---|---|
| Democratic | Paul Simon (incumbent) | 110,298 | 65.63 | -1.75% | |
| Republican | John T. Anderson | 57,763 | 34.37 | +1.75% | |
| Total votes | 168,061 | 100.0 | |||
| Party | Candidate | Votes | % | ±% | |
|---|---|---|---|---|---|
| Democratic | Paul Simon (incumbent) | 152,344 | 67.38 | +7.83% | |
| Republican | Peter G. Prineas | 73,766 | 32.62 | -7.83% | |
| Total votes | 226,110 | 100.0 | |||
| Party | Candidate | Votes | % | ±% | |
|---|---|---|---|---|---|
| Democratic | Paul Simon | 108,417 | 59.55 | -34.10% | |
| Republican | Val Oshel | 73,634 | 40.45 | N/A | |
| Total votes | 182,051 | 100.0 | |||
| Party | Candidate | Votes | % | ±% | |
|---|---|---|---|---|---|
| Democratic | Kenneth J. Gray | 138,867 | 93.65 | +19.43% | |
| Independent | Hugh Muldoon | 9,398 | 6.34 | N/A | |
| Write-in | 13 | 0.01 | N/A | ||
| Total votes | 148,278 | 100.0 | |||
| Party | Candidate | Votes | % | ±% | |
|---|---|---|---|---|---|
| Democratic | Melvin Price (incumbent) | 88,637 | 74.22 | +2.90% | |
| Republican | Scott R. Randolph | 30,784 | 25.78 | -2.90% | |
| Total votes | 119,421 | 100.0 | |||
| Party | Candidate | Votes | % | ±% | |
|---|---|---|---|---|---|
| Democratic | Melvin Price (incumbent) | 113,507 | 71.32 | -0.16% | |
| Republican | John S. Guthrie | 45,649 | 28.68 | +0.16% | |
| Total votes | 159,156 | 100.0 | |||
| Party | Candidate | Votes | % | ±% | |
|---|---|---|---|---|---|
| Democratic | Melvin Price (incumbent) | 82,513 | 71.48 | -4.24% | |
| Republican | John S. Guthrie | 32,915 | 28.52 | +4.24% | |
| Total votes | 115,428 | 100.0 | |||
| Party | Candidate | Votes | % | ±% | |
|---|---|---|---|---|---|
| Democratic | Melvin Price (incumbent) | 144,743 | 75.72 | +1.97% | |
| Republican | G. S. (Kenneth) Mirza | 46,419 | 24.28 | -1.97% | |
| Total votes | 191,162 | 100.0 | |||
| Party | Candidate | Votes | % | ±% | |
|---|---|---|---|---|---|
| Democratic | Melvin Price (incumbent) | 95,522 | 73.75 | +1.53% | |
| Republican | Kurt Glaser | 33,993 | 26.25 | -1.53% | |
| Total votes | 129,515 | 100.0 | |||
| Party | Candidate | Votes | % | ±% | |
|---|---|---|---|---|---|
| Democratic | Melvin Price (incumbent) | 144,560 | 72.22 | -3.83% | |
| Republican | Phyllis Stewart Schlafly | 55,620 | 27.78 | +3.83% | |
| Total votes | 200,180 | 100.0 | |||
| Party | Candidate | Votes | % | ±% | |
|---|---|---|---|---|---|
| Democratic | Melvin Price (incumbent) | 94,231 | 76.05 | +7.84% | |
| Republican | Alex Chouinard | 29,670 | 23.95 | -7.84% | |
| Total votes | 123,901 | 100.0 | |||
| Party | Candidate | Votes | % | ±% | |
|---|---|---|---|---|---|
| Democratic | Melvin Price (incumbent) | 121,381 | 68.21 | -0.94% | |
| Republican | Waldo E. (Ernie) Schellenger | 56,568 | 31.79 | +0.94% | |
| Total votes | 177,949 | 100.0 | |||
| Party | Candidate | Votes | % | ±% | |
|---|---|---|---|---|---|
| Democratic | Melvin Price (incumbent) | 90,482 | 69.15 | +4.35% | |
| Republican | John T. Thomas | 40,358 | 30.85 | -4.35% | |
| Total votes | 130,840 | 100.0 | |||
| Party | Candidate | Votes | % | ±% | |
|---|---|---|---|---|---|
| Democratic | Melvin Price | 117,408 | 64.80 | +20.12% | |
| Republican | Phyllis Stewart Schlafly | 63,778 | 35.20 | -20.12% | |
| Total votes | 181,186 | 100.0 | |||
| Party | Candidate | Votes | % | ±% | |
|---|---|---|---|---|---|
| Republican | Charles W. Vursell | 62,692 | 55.32 | +4.68% | |
| Democratic | John David Upchurch | 50,638 | 44.68 | -4.67% | |
| Total votes | 113,330 | 100.0 | |||
| Party | Candidate | Votes | % | ±% | |
|---|---|---|---|---|---|
| Republican | Charles W. Vursell | 57,732 | 50.64 | -8.23% | |
| Democratic | John David Upchurch | 56,262 | 49.35 | +8.22% | |
| Write-in | 1 | 0.00 | N/A | ||
| Total votes | 113,995 | 100.0 | |||
| Party | Candidate | Votes | % | ±% | |
|---|---|---|---|---|---|
| Republican | Roy Clippinger (incumbent) | 37,909 | 58.87 | -40.04% | |
| Democratic | Edward Hines | 26,483 | 41.13 | N/A | |
| Total votes | 64,392 | 100.0 | |||
| Party | Candidate | Votes | % | ±% | |
|---|---|---|---|---|---|
| Republican | Roy Clippinger | 5,617 | 98.91 | +40.69% | |
| Write-in | 62 | 1.09 | N/A | ||
| Total votes | 5,679 | 100.0 | |||
| Party | Candidate | Votes | % | ±% | |
|---|---|---|---|---|---|
| Republican | James V. Heidinger (incumbent) | 42,927 | 58.22 | -0.17% | |
| Democratic | Early C. Phelps | 30,808 | 41.78 | +0.17% | |
| Total votes | 73,735 | 100.0 | |||
| Party | Candidate | Votes | % | ±% | |
|---|---|---|---|---|---|
| Republican | James V. Heidinger (incumbent) | 37,008 | 58.39 | +4.79% | |
| Democratic | LeRoy Barham | 26,377 | 41.61 | -4.79% | |
| Total votes | 63,385 | 100.0 | |||
| Party | Candidate | Votes | % | ±% | |
|---|---|---|---|---|---|
| Republican | James V. Heidinger | 49,731 | 53.60 | +4.70% | |
| Democratic | Claude V. Parsons (incumbent) | 43,050 | 46.40 | -4.70% | |
| Total votes | 92,781 | 100.0 | |||
| Party | Candidate | Votes | % | ±% | |
|---|---|---|---|---|---|
| Democratic | Claude V. Parsons (incumbent) | 40,633 | 51.10 | -0.58% | |
| Republican | R. R. Randolph | 38,889 | 48.90 | +0.58% | |
| Total votes | 79,522 | 100.0 | |||
| Party | Candidate | Votes | % | ±% | |
|---|---|---|---|---|---|
| Democratic | Claude V. Parsons (incumbent) | 45,740 | 51.68 | +0.01% | |
| Republican | W. A. Spenoe | 42,764 | 48.32 | -0.01% | |
| Total votes | 88,504 | 100.0 | |||
| Party | Candidate | Votes | % | ±% | |
|---|---|---|---|---|---|
| Democratic | Claude V. Parsons (incumbent) | 39,442 | 51.67 | -7.15% | |
| Republican | James V. Heidinger | 36,891 | 48.33 | +7.15% | |
| Total votes | 76,333 | 100.0 | |||
| Party | Candidate | Votes | % | ±% | |
|---|---|---|---|---|---|
| Democratic | Claude V. Parsons (incumbent) | 43,107 | 58.82 | +8.64% | |
| Republican | Arthur A. Miles | 30,175 | 41.18 | -8.64% | |
| Total votes | 73,282 | 100.0 | |||
| Party | Candidate | Votes | % | ±% | |
|---|---|---|---|---|---|
| Democratic | Claude V. Parsons | 26,929 | 50.18 | +8.62% | |
| Republican | James V. Heidinger | 26,732 | 49.82 | -8.62% | |
| Total votes | 53,661 | 100.0 | |||
| Party | Candidate | Votes | % | ±% | |
|---|---|---|---|---|---|
| Republican | Thomas S. Williams (incumbent) | 36,239 | 58.44 | +2.38% | |
| Democratic | Val B. Campbell | 25,773 | 41.56 | -2.38% | |
| Total votes | 62,012 | 100.0 | |||
| Party | Candidate | Votes | % | ±% | |
|---|---|---|---|---|---|
| Republican | Thomas S. Williams (incumbent) | 26,295 | 56.06 | +1.92% | |
| Democratic | John Marshall Karns | 20,612 | 43.94 | -1.92% | |
| Total votes | 46,907 | 100.0 | |||
| Party | Candidate | Votes | % | ±% | |
|---|---|---|---|---|---|
| Republican | Thomas S. Williams (incumbent) | 35,356 | 54.14 | +3.37% | |
| Democratic | H. Robert Fowler | 29,954 | 45.86 | -3.36% | |
| Total votes | 65,310 | 100.0 | |||
| Party | Candidate | Votes | % | ±% | |
|---|---|---|---|---|---|
| Republican | Thomas S. Williams (incumbent) | 29,141 | 50.77 | -10.14% | |
| Democratic | Dempsey T. Woodard | 28,252 | 49.22 | +14.36% | |
| Write-in | 1 | 0.00 | N/A | ||
| Total votes | 57394 | 100.0 | |||
| Party | Candidate | Votes | % | ±% | |
|---|---|---|---|---|---|
| Republican | Thomas S. Williams (incumbent) | 38,472 | 60.91 | +1.55% | |
| Democratic | Asher R. Cox | 22,019 | 34.86 | -4.56% | |
| Farmer–Labor | J. W. Bobinet | 2,676 | 4.24 | N/A | |
| Total votes | 63,167 | 100.0 | |||
| Party | Candidate | Votes | % | ±% | |
|---|---|---|---|---|---|
| Republican | Thomas S. Williams (incumbent) | 18,689 | 59.36 | +4.37% | |
| Democratic | James R. Campbell | 12,412 | 39.42 | -3.47% | |
| Socialist | J. J. McGuinn | 382 | 1.21 | -0.91% | |
| Total votes | 31,483 | 100.0 | |||
| Party | Candidate | Votes | % | ±% | |
|---|---|---|---|---|---|
| Republican | Thomas S. Williams (incumbent) | 23,768 | 54.99 | +5.08% | |
| Democratic | Louis W. Goetzman | 18,540 | 42.89 | -4.45% | |
| Socialist | Jno. H Evans | 916 | 2.12 | +2.09% | |
| Write-in | 1 | 0.00 | — | ||
| Total votes | 43,225 | 100.0 | |||
| Party | Candidate | Votes | % | ±% | |
|---|---|---|---|---|---|
| Republican | Thomas S. Williams | 18,311 | 49.91 | +13.81% | |
| Democratic | H. Robert Fowler (incumbent) | 17,369 | 47.34 | -0.33% | |
| Progressive | A. J. Gibbons | 995 | 2.71 | -9.63% | |
| Socialist | Noah C. Bainum | 12 | 0.03 | -2.22% | |
| Write-in | 1 | 0.00 | N/A | ||
| Total votes | 36,688 | 100.0 | |||
| Party | Candidate | Votes | % | ±% | |
|---|---|---|---|---|---|
| Democratic | H. Robert Fowler (incumbent) | 19,811 | 47.67 | -1.15% | |
| Republican | James B. Blackman | 15,004 | 36.10 | -11.82% | |
| Progressive | A. J. Gibbons | 5,129 | 12.34 | N/A | |
| Socialist | T. C. Mason | 933 | 2.25 | +0.77% | |
| Prohibition | T. J. Scott | 682 | 1.64 | -0.14% | |
| Total votes | 41,559 | 100.0 | |||
| Party | Candidate | Votes | % | ±% | |
|---|---|---|---|---|---|
| Democratic | H. Robert Fowler | 17,235 | 48.82 | +4.84% | |
| Republican | Pleasant T. Chapman (incumbent) | 16,918 | 47.92 | -4.46% | |
| Prohibition | T. J. Scott | 630 | 1.78 | -0.79% | |
| Socialist | M. S. Dickerson | 521 | 1.48 | +0.40% | |
| Total votes | 35,304 | 100.0 | |||
| Party | Candidate | Votes | % | ±% | |
|---|---|---|---|---|---|
| Republican | Pleasant T. Chapman (incumbent) | 21,833 | 52.38 | +1.21% | |
| Democratic | John Q. Ledbetter | 18,333 | 43.98 | -2.14% | |
| Prohibition | Charles R. Montgomery | 1,070 | 2.57 | -0.13% | |
| Socialist | John Snyder | 448 | 1.08 | N/A | |
| Total votes | 41,684 | 100.0 | |||
| Party | Candidate | Votes | % | ±% | |
|---|---|---|---|---|---|
| Republican | Pleasant T. Chapman (incumbent) | 18,020 | 51.17 | +0.45% | |
| Democratic | James R. Williams | 16,241 | 46.12 | +0.07% | |
| Prohibition | George R. Leach | 952 | 2.70 | -0.34% | |
| Total votes | 35,213 | 100.0 | |||
| Party | Candidate | Votes | % | ±% | |
|---|---|---|---|---|---|
| Republican | Pleasant T. Chapman | 20,556 | 50.72 | +1.96% | |
| Democratic | James R. Williams (incumbent) | 18,664 | 46.05 | -3.40% | |
| Prohibition | Wilbur A. Morgan | 1,231 | 3.04 | +1.25% | |
| Populist | Edward Turner | 75 | 0.19 | N/A | |
| Total votes | 40,526 | 100.0 | |||
| Party | Candidate | Votes | % | |
|---|---|---|---|---|
| Democratic | James R. Williams | 17,971 | 49.45 | |
| Republican | Pleasant T. Chapman | 17,719 | 48.76 | |
| Prohibition | William T. Morris | 651 | 1.79 | |
| Total votes | 36,341 | 100.0 | ||
New Jersey's 10th congressional district is an urban congressional district in the U.S. state of New Jersey. The district consists of portions of Essex, Hudson and Union counties, and includes the cities of Newark and Orange. The district is majority African American and has been represented in Congress by Democrat Donald Payne Jr. since November 2012.

Maryland's 5th congressional district comprises all of Charles, St. Mary's, and Calvert counties, as well as portions of Prince George's and Anne Arundel counties. The district is currently represented by Democrat Steny Hoyer, who from 2007 to 2011 and from 2019 to 2023 was House Majority Leader.

Kentucky's 6th congressional district is a congressional district in the U.S. state of Kentucky. Based in Central Kentucky, the district contains the cities of Lexington, Richmond, and Georgetown. The district is currently represented by Republican Andy Barr.
Ohio's 4th congressional district spans sections of the central part of the state. It is currently represented by Republican Jim Jordan, the current chair of the House Judiciary Committee, who has represented the district since 2007.

The 18th congressional district of Ohio is an obsolete congressional district last represented by Republican Bob Gibbs. The district voted for the majority party in the House of Representatives in every election since 1954.
The 43rd congressional district of New York was a congressional district for the United States House of Representatives in New York. It was created in 1913 as a result of the 1910 Census. It was eliminated in 1963 as a result of the 1960 Census. It was last represented by Charles E. Goodell who was redistricted into the 38th District.
Minnesota's 10th congressional district is an obsolete congressional district which existed from 1915 to 1933. It was created from the results of the 1910 census and generally consisted of the current 3rd and 6th districts and the southern portion of the 8th district. It was abolished following the 1930 census.

Virginia's fourth congressional district is a United States congressional district in the state of Virginia, taking in most of the area between Richmond and the North Carolina state line. It covers all or part of the counties of Brunswick, Charles City, Chesterfield, Dinwiddie, Greensville, Henrico, Prince George, Southampton, Surry, and Sussex, and all or part of the independent cities of Colonial Heights, Emporia, Hopewell, Petersburg, and Richmond. The district is currently represented by Democrat Jennifer McClellan, who was elected to the seat after she defeated Republican Leon Benjamin in the February 21, 2023 special election, caused by the death of incumbent Donald McEachin (D) on November 28, 2022.
The 13th congressional district of Illinois is currently represented by Democrat Nikki Budzinski.
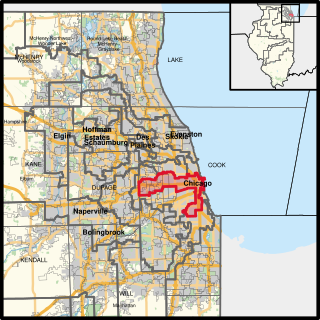
The 7th congressional district of Illinois covers parts of Cook County, as of the 2023 redistricting that followed the 2020 census. All or parts of Broadview, Bellwood, Chicago, Forest Park, Hillside, Oak Park, La Grange Park, Maywood, and Westchester are included. Democrat Danny K. Davis has represented the district since January 1997. With a Cook Partisan Voting Index rating of D+36, it is the most Democratic district in Illinois.

North Carolina's 8th congressional district is a congressional district that comprises a large portion of the southern Piedmont area of North Carolina from Concord to Spring Lake, including China Grove, Albemarle, Troy, and Raeford. The district includes all of Cabarrus County, Montgomery County, Hoke County, and Stanly County, as well as portions of Rowan County and Cumberland County.
Massachusetts's at-large congressional seat is an obsolete construct only used during the 1792–1793 United States House of Representatives elections in Massachusetts. In that election, one of the state's then-14 representatives to the U.S. House was elected statewide at-large. At that time, the U.S. state of Massachusetts included the District of Maine.

The 18th congressional district of Illinois covered central and western Illinois, including all of Jacksonville and Quincy and parts of Bloomington, Peoria, and Springfield. It was last represented by Republican Darin LaHood, who took office in September 2015 following a special election.

North Carolina's 5th congressional district covers the central western portion of North Carolina from the Appalachian Mountains to the western suburbs of the Piedmont Triad. The district borders Tennessee and Virginia, with the bulk of its territory in the mountains; it stretches just far enough to the east to grab its share of Forsyth County, home to most of its population.
Mississippi's 3rd congressional district (MS-3) covers central portions of state and stretches from the Louisiana border in the west to the Alabama border in the east.
The New Hampshire at-large congressional district is obsolete, with representation having since been divided into districts.
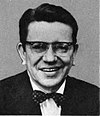
The 23rd congressional district of Illinois was a congressional district for the United States House of Representatives in Illinois. It was eliminated as a result of the redistricting cycle after the 1980 census. It was last represented by Melvin Price who was redistricted into the 21st district.
The 26th congressional district of Illinois was a congressional district for the United States House of Representatives in Illinois. The district was created in 1949 and was eliminated as a result of the 1950 census. Its only representative was C. W. Bishop who was redistricted from and into the 25th district.
The 25th congressional district of Illinois was a congressional district for the United States House of Representatives in Illinois. It was eliminated as a result of the 1960 census. It was last represented by Kenneth J. Gray who was redistricted into the 21st district.