Customer relationship management (CRM) is a process in which a business or other organization administers its interactions with customers, typically using data analysis to study large amounts of information.
A service-level agreement (SLA) is a commitment between a service provider and a client. Particular aspects of the service – quality, availability, responsibilities – are agreed between the service provider and the service user. The most common component of an SLA is that the services should be provided to the customer as agreed upon in the contract. As an example, Internet service providers and telcos will commonly include service level agreements within the terms of their contracts with customers to define the level(s) of service being sold in plain language terms. In this case, the SLA will typically have a technical definition of mean time between failures (MTBF), mean time to repair or mean time to recovery (MTTR); identifying which party is responsible for reporting faults or paying fees; responsibility for various data rates; throughput; jitter; or similar measurable details.
In the field of machine learning and specifically the problem of statistical classification, a confusion matrix, also known as an error matrix, is a specific table layout that allows visualization of the performance of an algorithm, typically a supervised learning one. Each row of the matrix represents the instances in an actual class while each column represents the instances in a predicted class, or vice versa – both variants are found in the literature. The name stems from the fact that it makes it easy to see whether the system is confusing two classes.

A performance indicator or key performance indicator (KPI) is a type of performance measurement. KPIs evaluate the success of an organization or of a particular activity in which it engages. KPIs provides a focus for strategic and operational improvement, create an analytical basis for decision making and help focus attention on what matters most.
The pavement condition index (PCI) is a numerical index between 0 and 100, which is used to indicate the general condition of a pavement section. The PCI is widely used in transportation civil engineering and asset management, and many municipalities use it to measure the performance of their road infrastructure and their levels of service. It is a statistical measure and requires manual survey of the pavement. This index was originally developed by the United States Army Corps of Engineers as an airfield pavement rating system, but later modified for roadway pavements and standardized by the ASTM. The surveying processes and calculation methods have been documented and standardized by ASTM for both roads and airport pavements:

A road is a thoroughfare, route, or way on land between two places that has been surfaced or otherwise improved to allow travel by foot or some form of conveyance, including a motor vehicle, cart, bicycle, or horse. Roads have been adapted to a large range of structures and types in order to achieve a common goal of transportation under a large and wide range of conditions. The specific purpose, mode of transport, material and location of a road determine the characteristics it must have in order to maximize its usefulness. Following is one classification scheme.

Water supply and sanitation in Latin America is characterized by insufficient access and in many cases by poor service quality, with detrimental impacts on public health. Water and sanitation services are provided by a vast array of mostly local service providers under an often fragmented policy and regulatory framework. Financing of water and sanitation remains a serious challenge.
Pavement management is the process of planning the maintenance and repair of a network of roadways or other paved facilities in order to optimize pavement conditions over the entire network.
An asset management plan (AMP) is a tactical plan for managing an organisation's infrastructure and other assets to deliver an agreed standard of service. Typically, an asset management plan will cover more than a single asset, taking a system approach - especially where a number of assets are co-dependent and are required to work together to deliver an agreed standard of service.
Fulfillment of telecommunications services involves a series of supply chain activities responsible for assembling and making services available to subscribers. These activities delineate an operational infrastructure whose efficiency relies upon its ability to allow a communications service provider (CSP) to match the supply of services with demand in an economical way and with consistently high levels of quality and reliability.

The international roughness index (IRI) is the roughness index most commonly obtained from measured longitudinal road profiles. It is calculated using a quarter-car vehicle math model, whose response is accumulated to yield a roughness index with units of slope. Although a universal term, IRI is calculated per wheelpath, but can be expanded to a Mean Roughness Index (MRI) when both wheelpath profiles are collected. This performance measure has less stochasticity and subjectivity in comparison to other pavement performance indicators, such as PCI, but it is not completely devoid of randomness. The sources of variability in IRI data include the difference among the readings of different runs of the test vehicle and the difference between the readings of the right and left wheel paths. Despite these facts, since its introduction in 1986, the IRI has become the road roughness index most commonly used worldwide for evaluating and managing road systems.
Infrastructure asset management is the integrated, multidisciplinary set of strategies in sustaining public infrastructure assets such as water treatment facilities, sewer lines, roads, utility grids, bridges, and railways. Generally, the process focuses on the later stages of a facility's life cycle, specifically maintenance, rehabilitation, and replacement. Asset management specifically uses software tools to organize and implement these strategies with the fundamental goal to preserve and extend the service life of long-term infrastructure assets which are vital underlying components in maintaining the quality of life in society and efficiency in the economy. In the 21st century, climate change adaptation has become an important part of infrastructure asset management competence.
Service quality (SQ), in its contemporary conceptualisation, is a comparison of perceived expectations (E) of a service with perceived performance (P), giving rise to the equation SQ=P-E. This conceptualistion of service quality has its origins in the expectancy-disconfirmation paradigm.
Bleeding or flushing is shiny, black surface film of asphalt on the road surface caused by upward movement of asphalt in the pavement surface. Common causes of bleeding are too much asphalt in asphalt concrete, hot weather, low space air void content and quality of asphalt. Bleeding is a safety concern since it results in a very smooth surface, without the texture required to prevent hydroplaning. Road performance measures such as IRI cannot capture the existence of bleeding as it does not increase the surface roughness. But other performance measures such as PCI do include bleeding.
Data center management is the collection of tasks performed by those responsible for managing ongoing operation of a data center This includes Business service management and planning for the future.

Pavement performance modeling or pavement deterioration modeling is the study of pavement deterioration throughout its life-cycle. The health of pavement is assessed using different performance indicators. Some of the most well-known performance indicators are Pavement Condition Index (PCI), International Roughness Index (IRI) and Present Serviceability Index (PSI), but sometimes a single distress such as rutting or the extent of crack is used. Among the most frequently used methods for pavement performance modeling are mechanistic models, mechanistic-empirical models, survival curves and Markov models. Recently, machine learning algorithms have been used for this purpose as well. Most studies on pavement performance modeling are based on IRI.
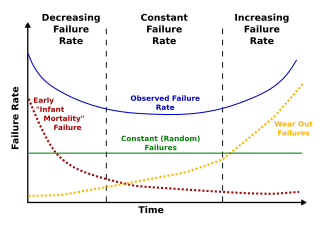
Deterioration modeling is the process of modeling and predicting the physical conditions of equipment, structures, infrastructure or any other physical assets. The condition of infrastructure is represented either using a deterministic index or the probability of failure. Examples of such performance measures are pavement condition index for roads or bridge condition index for bridges. For probabilistic measures, which are the focus of reliability theory, probability of failure or reliability index are used. Deterioration models are instrumental to infrastructure asset management and are the basis for maintenance and rehabilitation decision-making. The condition of all physical infrastructure degrade over time. A deterioration model can help decision-makers to understand how fast the condition drops or violates a certain threshold.
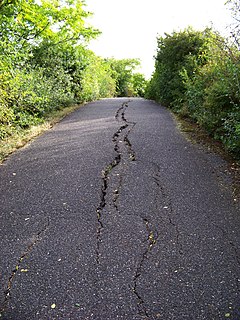
Pavement crack refers to a variety of types of pavement distresses that occur on the surface of pavements. Different types of pavements develop different cracks. Type of cracking is also correlated with the type of climate and traffic. Sometimes the cracks are aggregated using an index such as Crack index, and sometimes they are merged with other distresses and are reported using Pavement Condition Index.

Granular base equivalency or granular base equivalence (GBE) is a measure of total pavement thickness. Since pavement is composed of multiple layers with different physical properties, its total thickness is measured by GBE. GBE translates the thickness of different road layers to a number using a set of coefficients. So, to calculate the GBE, the depth of each layer should be multiplied by the granular equivalency factor for the material in that layer. In the next step the sum of the converted layer thicknesses is calculated. This sum is called granular base equivalency, which is a popular and important measure in pavement design and pavement performance modeling.
The present serviceability index (PSI) is a pavement performance measure. Introduced by the American Association of State Highway and Transportation Officials (AASHTO), the PSI is one of the most widely used pavement performance indicators after pavement condition index (PCI) and international roughness index (IRI). This performance indicator ranges between 0 and 5, 0 representing a failed pavement and 5 an excellent one. Since the PSI entails slope variance, it is correlated with performance indicators related to roughness such as IRI.
