This article needs additional citations for verification .(November 2007) |
Linear scheduling method (LSM) is a graphical scheduling method focusing on continuous resource utilization in repetitive activities.
This article needs additional citations for verification .(November 2007) |
Linear scheduling method (LSM) is a graphical scheduling method focusing on continuous resource utilization in repetitive activities.
LSM is used mainly in the construction industry to schedule resources in repetitive activities commonly found in highway, pipeline, high-rise building and rail construction projects. These projects are called repetitive or linear projects. The main advantages of LSM over critical path method (CPM) is its underlying idea of keeping resources continuously at work. In other words, it schedules activities in such a way that:
According to, [1] specific names for the linear scheduling method have been adopted, such as:
Project planning is part of project management, which relates to the use of schedules such as Gantt charts to plan and subsequently report progress within the project environment. Project planning can be done manually or by the use of project management software.

The critical path method (CPM), or critical path analysis (CPA), is an algorithm for scheduling a set of project activities. It is commonly used in conjunction with the program evaluation and review technique (PERT). A critical path is determined by identifying the longest stretch of dependent activities and measuring the time required to complete them from start to finish.
Project management software (PMS) has the capacity to help plan, organize, and manage resource tools and develop resource estimates. Depending on the sophistication of the software, it can manage estimation and planning, scheduling, cost control and budget management, resource allocation, collaboration software, communication, decision-making, quality management, time management and documentation or administration systems. Numerous PC and browser-based project management software and contract management software products and services are available.
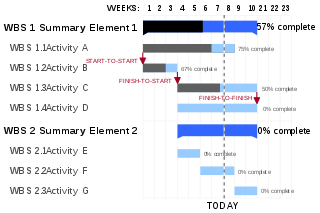
A Gantt chart is a type of bar chart that illustrates a project schedule, named after its popularizer, Henry Gantt (1861–1919), who designed such a chart around the years 1910–1915. Modern Gantt charts also show the dependency relationships between activities and the current schedule status.
In project management, a schedule is a listing of a project's milestones, activities, and deliverables. Usually dependencies and resources are defined for each task, then start and finish dates are estimated from the resource allocation, budget, task duration, and scheduled events. A schedule is commonly used in the project planning and project portfolio management parts of project management. Elements on a schedule may be closely related to the work breakdown structure (WBS) terminal elements, the Statement of work, or a Contract Data Requirements List.

In systems engineering, information systems and software engineering, the systems development life cycle (SDLC), also referred to as the application development life cycle, is a process for planning, creating, testing, and deploying an information system. The SDLC concept applies to a range of hardware and software configurations, as a system can be composed of hardware only, software only, or a combination of both. There are usually six stages in this cycle: requirement analysis, design, development and testing, implementation, documentation, and evaluation.
Scheduling is the process of arranging, controlling and optimizing work and workloads in a production process or manufacturing process. Scheduling is used to allocate plant and machinery resources, plan human resources, plan production processes and purchase materials.
Takt time, or simply takt, is a manufacturing term to describe the required product assembly duration that is needed to match the demand. Often confused with cycle time, takt time is a tool used to design work and it measures the average time interval between the start of production of one unit and the start of production of the next unit when items are produced sequentially. For calculations, it is the time to produce parts divided by the number of parts demanded in that time interval. The takt time is based on customer demand; if a process or a production line are unable to produce at takt time, either demand leveling, additional resources, or process re-engineering is needed to ensure on-time delivery.

A schedule or a timetable, as a basic time-management tool, consists of a list of times at which possible tasks, events, or actions are intended to take place, or of a sequence of events in the chronological order in which such things are intended to take place. The process of creating a schedule — deciding how to order these tasks and how to commit resources between the variety of possible tasks — is called scheduling, and a person responsible for making a particular schedule may be called a scheduler. Making and following schedules is an ancient human activity.
In project management, resource leveling is defined by A Guide to the Project Management Body of Knowledge as "A technique in which start and finish dates are adjusted based on resource limitation with the goal of balancing demand for resources with the available supply." Resource leveling problem could be formulated as an optimization problem. The problem could be solved by different optimization algorithms such as exact algorithms or meta-heuristic methods.
A sequence step algorithm (SQS-AL) is an algorithm implemented in a discrete event simulation system to maximize resource utilization. This is achieved by running through two main nested loops: A sequence step loop and a replication loop. For each sequence step, each replication loop is a simulation run that collects crew idle time for activities in that sequence step. The collected crew idle times are then used to determine resource arrival dates for user-specified confidence levels. The process of collecting the crew idle times and determining crew arrival times for activities on a considered sequence step is repeated from the first to the last sequence step.
Wind resource assessment is the process by which wind power developers estimate the future energy production of a wind farm. Accurate wind resource assessments are crucial to the successful development of wind farms.
A glossary of terms relating to project management and consulting.
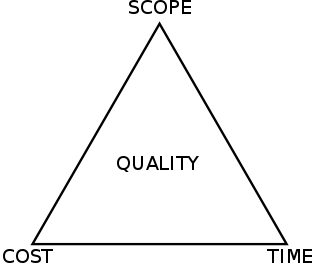
The project management triangle is a model of the constraints of project management. While its origins are unclear, it has been used since at least the 1950s. It contends that:
DynaRoad is a project management software for heavy civil engineering projects. It is used for planning the mass hauls of an earthworks project, creating a construction schedule, and monitoring the progress of the project.
The Graphical Path Method (GPM) is a mathematically based algorithm used in project management for planning, scheduling and resource control. GPM represents logical relationships of dated objects – such as activities, milestones, and benchmarks – in a time-scaled network diagram.

A time–distance diagram is generally a diagram with one axis representing time and the other axis distance. Such charts are used in the aviation industry to plot flights, or in scientific research to present effects in respect to distance over time. Transport schedules in graphical form are also called time–distance diagrams, they represent the location of a given vehicle along the transport route.
The following outline is provided as an overview of and topical guide to project management:
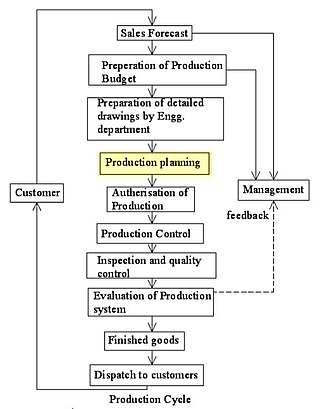
Production planning is the planning of production and manufacturing modules in a company or industry. It utilizes the resource allocation of activities of employees, materials and production capacity, in order to serve different customers.