List of countries by plum production

Last updated

Countries by plum and sloe production in 2016 Countries by plum and sloe production in 2016.png
Countries by plum and sloe production in 2016
A map of world plum and sloe production, 2005 2005plums and sloes.PNG
A map of world plum and sloe production, 2005

This is a list of countries by plum and sloe production in 2016 and 2017, based on data from the Food and Agriculture Organization Corporate Statistical Database. [1] The estimated total world production of plum and sloe for 2017 was 11,758,135 metric tonnes, down 1% from 11,875,874 tonnes in 2016. [n 1] China was by far the largest producer, accounting for nearly 58% of global production.

Contents

Production by country

>100,000 tonnes

RankCountry/region20172016
1Flag of the People's Republic of China.svg  China 6,791,9746,632,558
Flag of Europe.svg  European Union [n 2] 1,292,8561,474,983
2Flag of Romania.svg  Romania 434,390512,975
3Flag of the United States.svg  United States 423,200264,990
4Flag of Serbia.svg  Serbia 330,582471,442
5Flag of Iran.svg  Iran 298,893263,395
6Flag of Turkey.svg  Turkey 291,934297,589
7Flag of Chile.svg  Chile 290,175293,216
8Flag of India.svg  India 269,467262,197
9Flag of Italy.svg  Italy 206,966220,729
10Flag of France.svg  France 205,031211,269
11Flag of Ukraine.svg  Ukraine 200,470178,320
12Flag of Morocco.svg  Morocco 179,387123,577
13Flag of Spain.svg  Spain 172,325193,598
14Flag of Russia.svg  Russia 146,377164,602
15Flag of Uzbekistan.svg  Uzbekistan 115,966120,263
16Flag of Algeria.svg  Algeria 111,797102,692

10,000–100,000 tonnes

RankCountry/region20172016
17Flag of Mexico.svg  Mexico 83,60777,931
18Flag of South Korea.svg  South Korea 82,94678,857
19Flag of Moldova.svg  Moldova 76,16499,716
20Flag of South Africa.svg  South Africa 75,66887,030
21Flag of Bosnia and Herzegovina.svg  Bosnia and Herzegovina 74,398131,579
22Flag of Poland.svg  Poland 58,403109,503
23Flag of Pakistan.svg  Pakistan 56,20855,129
24Flag of Turkmenistan.svg  Turkmenistan 53,34650,942
25Flag of Libya.svg  Libya 52,48351,977
26Flag of Bulgaria.svg  Bulgaria 49,19448,630
27Flag of Hungary.svg  Hungary 43,67847,560
28Flag of Albania.svg  Albania 42,43740,180
29Flag of Argentina.svg  Argentina 39,110150,229
30Flag of Azerbaijan.svg  Azerbaijan 33,55928,793
31Flag of Syria.svg  Syria 30,99330,949
32Flag of Portugal.svg  Portugal 29,51526,067
33Flag of Greece.svg  Greece 25,50023,780
34Flag of the Taliban.svg  Afghanistan 25,27418,504
35Flag of Israel.svg  Israel 24,50019,500
36Flag of Armenia.svg  Armenia 24,01615,684
37Flag of Germany.svg  Germany 23,88537,783
38Flag of Lebanon.svg  Lebanon 23,36523,493
39Flag of Japan.svg  Japan 19,60023,000
40Flag of North Macedonia.svg  Macedonia 17,88033,684
41Flag of Australia (converted).svg  Australia 17,86217,992
42Flag of Tunisia.svg  Tunisia 16,11515,500
43Flag of Colombia.svg  Colombia 16,08116,703
44Flag of the Republic of China.svg  Taiwan 12,42413,727
45Flag of Kyrgyzstan (2023).svg  Kyrgyzstan 12,20610,877

1,000–10,000 tonnes

RankCountry/region20172016
46Flag of Egypt.svg  Egypt 9,73612,187
47Flag of Austria.svg  Austria 9,7217,783
48Flag of Montenegro.svg  Montenegro 9,2318,902
49Flag of Nepal.svg    Nepal 9,11910,563
50Flag of Ecuador.svg  Ecuador 8,8788,834
51Flag of Croatia.svg  Croatia 8,2099,420
52Flag of the United Kingdom.svg  United Kingdom 8,0009,200
53Flag of Peru.svg  Peru 7,4139,031
54Flag of Kazakhstan.svg  Kazakhstan 6,7015,410
55Flag of Switzerland (Pantone).svg   Switzerland 5,8165,766
56Flag of the Netherlands.svg  Netherlands 5,7895,543
57Flag of Tanzania.svg  Tanzania 5,0914,684
58Flag of Canada (Pantone).svg  Canada 4,6263,092
59Flag of Slovenia.svg  Slovenia 4,5003,267
60Flag of Tajikistan.svg  Tajikistan 4,3303,830
61Flag of the Czech Republic.svg  Czech Republic 4,0655,998
62Flag of Georgia.svg  Georgia 3,8008,500
63Flag of Jordan.svg  Jordan 3,7927,051
64Flag of Iraq.svg  Iraq 3,5793,421
65Flag of Belarus.svg  Belarus 3,29322,228
66Bandera de Bolivia (Estado).svg  Bolivia 2,9512,989
67Flag of Madagascar.svg  Madagascar 2,2672,244
68Flag of Kenya.svg  Kenya 2,1181,952
69Flag of Uruguay.svg  Uruguay 2,0361,259
70Flag of Paraguay.svg  Paraguay 1,8341,815
71Flag of Palestine.svg  Palestine 1,7331,733
72Flag of New Zealand.svg  New Zealand 1,6801,818
73Flag of Eswatini.svg  Swaziland 1,3011,317
74Flag of Norway.svg  Norway 1,2011,842
75Flag of Cyprus.svg  Cyprus 1,1831,178

<1,000 tonnes

RankCountry/region20172016
76Flag of Slovakia.svg  Slovakia 993494
77Flag of Grenada.svg  Grenada 764759
78Flag of Cameroon.svg  Cameroon 631617
79Flag of Bhutan.svg  Bhutan 482376
80Flag of Lithuania.svg  Lithuania 409832
81Flag of Denmark.svg  Denmark 359330
82Flag of Estonia.svg  Estonia 266210
83Flag of Zimbabwe.svg  Zimbabwe 259255
84Flag of Sweden.svg  Sweden 250200
85Flag of Malawi.svg  Malawi 162N/A
86Flag of Luxembourg.svg  Luxembourg 150120
87Flag of Latvia.svg  Latvia 58104
88Flag of Belgium (civil).svg  Belgium 1712

Notes

  1. Sum of values for countries with available data, which may be official or FAO data based on imputation methodology
  2. Value for a specific year is the sum of the available values for EU member states for that year

Related Research Articles

<span class="mw-page-title-main">Plum</span> Edible fruit

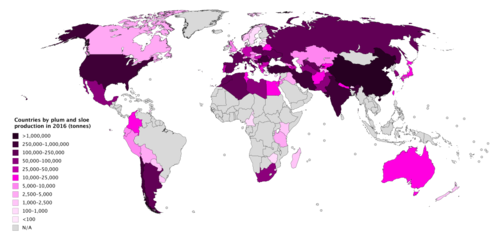
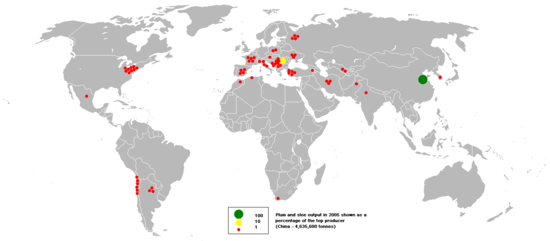
A plum is a fruit of some species in Prunus subg. Prunus. Dried plums are most often called prunes, though in the United States they may be just labeled as 'dried plums', especially during the 21st century.

<span class="mw-page-title-main">World fisheries production</span>

The global commercial production for human use of fish and other aquatic organisms occurs in two ways: they are either captured wild by commercial fishing or they are cultivated and harvested using aquacultural and farming techniques.

<span class="mw-page-title-main">Agriculture in Albania</span> Economic activity

Agriculture in Albania is still a significant sector of the economy of Albania, which contributes to 22.5% of the country's GDP. The country spans 28,748 square kilometres of which 24% is agricultural land, 36% forest land, 15% pasture and meadow and 25% urban areas including lakes, waterways, unused rocky and mountain land. It can be separated into three main zones such as the lowland zone alongside the coastline of the country, the hill zone in the lowland and the mountain zone.

<span class="mw-page-title-main">Banana industry</span> Agricultural sector

The banana industry is an important part of the global industrial agrobusiness. About 15% of the global banana production goes to export and international trade for consumption in Western countries. They are grown on banana plantations primarily in the Americas.

References

  1. "Crops". FAOSTAT. Retrieved 5 August 2019. Countries - Select All; Regions - World + (Total); Elements - Production Quantity; Items - Plums and sloes; Years - 2017 + 2016