The middle of the 20th century was marked by a significant and persistent increase in fertility rates in many countries of the world, especially in the Western world. The term baby boom is often used to refer to this particular boom, generally considered to have started immediately after World War II, although some demographers place it earlier or during the war.[ citation needed ] This terminology led to those born during this baby boom being nicknamed the baby boomer generation.
The boom coincided with a marriage boom. [3] The increase in fertility was driven primarily by a decrease in childlessness and an increase in parity progression to a second child. In most of the Western countries, progression to a third child and beyond declined, which, coupled with aforementioned increase in transition to first and second child, resulted in higher homogeneity in family sizes. The baby boom was most prominent among educated and economically active women. [4] [5]
The baby boom ended with a significant decline in fertility rates in the 1960s and 1970s, later called the baby bust by demographers. [6]
Economist and demographer Richard Easterlin in his "Twentieth Century American Population Growth" (2000), explains the growth pattern of the American population in the 20th century by examining the fertility rate fluctuations and the decreasing mortality rate. Easterlin attempts to prove the cause of the baby boom and baby bust by the "relative income" theory, despite the various other theories that these events have been attributed to. The "relative income" theory suggests that couples choose to have children based on a couple's ratio of potential earning power and the desire to obtain material objects. This ratio depends on the economic stability of the country and how people are raised to value material objects. The "relative income" theory explains the baby boom by suggesting that the late 1940s and the 1950s brought low desires to have material objects, because of the Great Depression and World War II, as well as plentiful job opportunities (being a post-war period). These two factors gave rise to a high relative income, which encouraged high fertility. Following this period, the next generation had a greater desire for material objects, however, an economic slowdown in the United States made jobs harder to acquire. This resulted in lower fertility rates causing the Baby Bust. [7]
Jan Van Bavel and David S. Reher proposed that the increase in nuptiality (marriage boom) coupled with low efficiency of contraception was the main cause of the baby boom. They doubted the explanations (including the Easterlin hypothesis) which considered the post-war economic prosperity that followed deprivation of the Great Depression as main cause of the baby boom, stressing that GDP-birth rate association was not consistent (positive before 1945 and negative after) with GDP growth accounting for a mere 5 percent of the variance in the crude birth rate over the period studied by the authors. [8] Data shows that only in a few countries was there a significant and persistent increase in the marital fertility index during the baby boom, which suggests that most of the increase in fertility was driven by the increase in marriage rates. [9]
Jona Schellekens claims that the rise in male earnings that started in the late 1930s accounts for most of the rise in marriage rates and that Richard Easterlin's hypothesis according to which a relatively small birth cohort entering the labor market caused the marriage boom is not consistent with data from the United States. [10]
Matthias Doepke, Moshe Hazan, and Yishay Maoz all argued that the baby boom was mainly caused by the alleged crowding out from the labor force of females who reached adulthood during the 1950s by females who started to work during the Second World War and did not quit their jobs after the economy recovered. [11] Andriana Bellou and Emanuela Cardia promote a similar argument, but they claim women who entered the labor force during the Great Depression crowded out women who participated in the baby boom. [12] Glenn Sandström disagrees with both variants of this interpretation based on the data from Sweden showing that an increase in nuptiality (which was one of the main causes of an increase in fertility) was limited to economically active women. He pointed out that in 1939 a law prohibiting the firing of a woman when she got married was passed in the country. [13]
Greenwood, Seshadri, and Vandenbroucke ascribe the baby boom to the diffusion of new household appliances that led to reduction of costs of childbearing. [14] However Martha J. Bailey and William J. Collins criticize their explanation on the basis that improvement of household technology began before baby boom, differences and changes in ownership of appliances and electrification in U.S. counties are negatively correlated with birth rates during baby boom, that the correlation between cohort fertility of the relevant women and access to electrical service in early adulthood is negative, and that Amish also experienced the baby boom. [15]
Judith Blake and Prithwis Das Gupta point out the increase in ideal family size in the times of baby boom. [16]
Peter Lindert partially attribute the baby boom to the extension of income tax coverage on most of the US population in the early 1940s. The latter actualize already existed[ vague ] and newly created tax exemptions for children and married couples creating the new incentive for earlier marriage and higher fertility. [17] It is proposed that because the taxation was progressive the baby boom was more pronounced among the richer population. [18]
In the United States and Canada, the baby boom was among the largest in the world. [19] In 1946, live births in the U.S. surged from 222,721 in January to 339,499 in October. By the end of the 1940s, about 32 million babies had been born, compared with 24 million in the 1930s. In 1954, annual births first topped four million and did not drop below that figure until 1965, by which time four out of ten Americans were under the age of 20. [20] As a result of the baby boom and traditional gender roles, getting married immediately after high school became commonplace and women increasingly encountered tremendous pressure to marry by the age of 20. A joke emerged at the time around comedic speculation that women were going to college to earn their MRS degree due to the increased marriage rate. [21]
The baby boom was stronger among American Catholics than among Protestants. [22]
The exact beginning and end of the baby boom is debated. The U.S. Census Bureau defines baby boomers as those born between mid-1946 and mid-1964, [2] although the U.S. birth rate began to increase in 1941, and decline after 1957. Deborah Carr considers baby boomers to be those born between 1944 and 1959, [23] while Strauss and Howe place the beginning of the baby boom in 1943. [24] In Canada the baby boom is usually defined as occurring from 1947 to 1966. Canadian soldiers were repatriated later than American servicemen, and Canada's birthrate did not start to rise until 1947. Most Canadian demographers prefer to use the later date of 1966 as the boom's end year in that country. The later end to the boom in Canada than in the US has been ascribed to a later adoption of birth control pills. [25] [26]
In the United States, more babies were born during the seven years after 1948 than in the previous thirty, causing a shortage of teenage babysitters. At one point during this period, Madison, New Jersey only had fifty babysitters for its population of 8,000, dramatically increasing demand for sitters. In 1950, out of every $7 that a California couple spent to go to the movies, $5 went to paying a babysitter. [27]
France and Austria experienced the strongest baby booms in Europe. [19] In contrast to most other countries, the French and Austrian baby booms were driven primarily by an increase in marital fertility. [28] In the French case, pronatalist policies were an important factor in this increase. [29] Weaker baby booms occurred in Germany, Switzerland, Belgium and the Netherlands. [30]
In the United Kingdom the baby boom occurred in two waves. After a short first wave of the baby boom during the war and immediately after, peaking in 1946, the United Kingdom experienced a second wave during the 1960s, with a peak in births in 1964 and a rapid fall after the Abortion Act 1967 came into force. [31]
The baby boom in Ireland began during the Emergency declared in the country during the Second World War. [32] Laws on contraception were restrictive in Ireland, and the baby boom was more prolonged in this country. Secular decline of fertility began only in the 1970s and particularly after the legalization of contraception in 1979. The marriage boom was even more prolonged and did not recede until the 1980s. [33]
The baby boom was very strong in Norway and Iceland, significant in Finland, moderate in Sweden and relatively weak in Denmark. [19]
Baby boom was absent or not very strong in Italy, Greece, Portugal and Spain. [19] There were however regional variations in Spain, with a considerable baby boom occurring in regions such as Catalonia. [34]
There was a strong baby boom in Czechoslovakia, but it was weak or absent in Poland, Bulgaria, Russia, Estonia and Lithuania, partly as a result of the Soviet famine of 1946–1947. [19] [35]
The volume of baby boom was the largest in the world in New Zealand and second-largest in Australia. [19] Like the US, the New Zealand baby boom was stronger among Catholics than Protestants. [36]
The author and columnist Bernard Salt places the Australian baby boom between 1946 and 1961. [37] [38]
Along with the developed countries of the West, many developing countries (among them Morocco, China and Turkey) also witnessed the baby boom. [39] The baby boom in Mongolia, one of such developing countries, is probably explained by improvement in health and living standards related to the adoption of technologies and modernisation. [40]
There was also a baby boom in Latin American countries, excepting Brazil, Argentina and Uruguay. An increase in fertility was driven by a decrease in childlessness and, in most nations, by an increase in parity progression to second, third and fourth births. Its magnitude was largest in Costa Rica and Panama. [41]
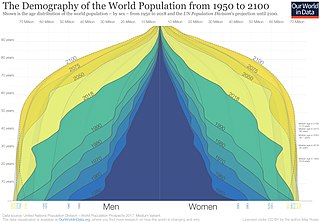
Demography is the statistical study of human populations: their size, composition, and how they change through the interplay of fertility (births), mortality (deaths), and migration.
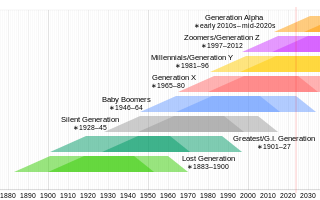
Baby boomers, often shortened to boomers, are the demographic cohort following the Silent Generation and preceding Generation X. The generation is often defined as people born from 1946 to 1964 during the mid-20th century baby boom. The dates, the demographic context, and the cultural identifiers may vary by country. Most baby boomers are children of either the Greatest Generation or the Silent Generation, and are often parents of Gen Xers and Millennials.
The United States had an official estimated resident population of 334,914,895 on July 1, 2023, according to the U.S. Census Bureau. This figure includes the 50 states and the District of Columbia but excludes the population of five unincorporated U.S. territories as well as several minor island possessions. The United States is the third most populous country in the world. The Census Bureau showed a population increase of 0.4% for the twelve-month period ending in July 2022, below the world average annual rate of 0.9%. The total fertility rate in the United States estimated for 2022 is 1.665 children per woman, which is below the replacement fertility rate of approximately 2.1.
The United States is a country primarily located in North America. Demographics of the United States concern matters of population density, ethnicity, education level, health of the populace, economic status, religious affiliations, and other aspects regarding the population.
In demography, demographic transition is a phenomenon and theory which refers to the historical shift from high birth rates and high death rates in societies with minimal technology, education and economic development, to low birth rates and low death rates in societies with advanced technology, education and economic development, as well as the stages between these two scenarios. In economic growth, the demographic transition has swept the world over the past two centuries, and the unprecedented population growth of the post-Malthusian period was reversed, reducing birth rates and population growth significantly in all regions of the world, and enabling economies to translate more of the gains of factor accumulation and technological progress into per capita income growth. The demographic transition strengthens economic growth process by three changes: (i) reduced dilution of capital and land stock, (ii) increased investment in human capital, and (iii) increased size of the labor force relative to the total population and changed age population distribution. Although this shift has occurred in many industrialized countries, the theory and model are frequently imprecise when applied to individual countries due to specific social, political and economic factors affecting particular populations.
A baby boom is a period marked by a significant increase of births. This demographic phenomenon is usually ascribed within certain geographical bounds of defined national and cultural populations. The cause of baby booms involves various fertility factors. The best-known baby boom occurred in the mid-twentieth century, sometimes considered to have started after the end of the Second World War, sometimes from the late 1940s, and ending in the 1960s. People born during this period are often called baby boomers.
Fertility is the ability to conceive a child. The fertility rate is the average number of children born during an individual's lifetime and is quantified demographically. Conversely, infertility is the difficulty or inability to reproduce naturally. In general, infertility is defined as not being able to conceive a child after one year of unprotected sex. Infertility is widespread, with fertility specialists available all over the world to assist parents and couples who experience difficulties conceiving a baby.
Birth rate, also known as natality, is the total number of live human births per 1,000 population for a given period divided by the length of the period in years. The number of live births is normally taken from a universal registration system for births; population counts from a census, and estimation through specialized demographic techniques. The birth rate is used to calculate population growth. The estimated average population may be taken as the mid-year population.
Zero population growth, sometimes abbreviated ZPG, is a condition of demographic balance where the number of people in a specified population neither grows nor declines; that is, the number of births plus in-migrants equals the number of deaths plus out-migrants. ZPG has been a prominent political movement since the 1960s.
The Total Fertility Rate (TFR) of a population is the average number of children that are born to a woman over her lifetime if:
Sub-replacement fertility is a total fertility rate (TFR) that leads to each new generation being less populous than the older, previous one in a given area. The United Nations Population Division defines sub-replacement fertility as any rate below approximately 2.1 children born per woman of childbearing age, but the threshold can be as high as 3.4 in some developing countries because of higher mortality rates. Taken globally, the total fertility rate at replacement was 2.33 children per woman in 2003. This can be "translated" as 2 children per woman to replace the parents, plus a "third of a child" to make up for the higher probability of males born and mortality prior to the end of a person's fertile life. In 2020, the average global fertility rate was around 2.4 children born per woman.
In statistics, epidemiology, marketing and demography, a cohort is a group of subjects who share a defining characteristic.
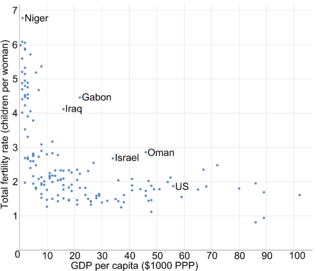
Income and fertility is the association between monetary gain on one hand, and the tendency to produce offspring on the other. There is generally an inverse correlation between income and the total fertility rate within and between nations. The higher the degree of education and GDP per capita of a human population, subpopulation or social stratum, the fewer children are born in any developed country. In a 1974 United Nations population conference in Bucharest, Karan Singh, a former minister of population in India, illustrated this trend by stating "Development is the best contraceptive." In 2015, this thesis was supported by Vogl, T.S., who concluded that increasing the cumulative educational attainment of a generation of parents was by far the most important predictor of the inverse correlation between income and fertility based on a sample of 48 developing countries.
In Demography, the rate of natural increase (RNI), also known as natural population change, is defined as the birth rate minus the death rate of a particular population, over a particular time period. It is typically expressed either as a number per 1,000 individuals in the population or as a percentage. RNI can be either positive or negative. It contrasts to total population change by ignoring net migration.
The ageing of Europe, also known as the greying of Europe, is a demographic phenomenon in Europe characterised by a decrease in fertility, a decrease in mortality rate, and a higher life expectancy among European populations. Low birth rates and higher life expectancy contribute to the transformation of Europe's population pyramid shape. The most significant change is the transition towards a much older population structure, resulting in a decrease in the proportion of the working age while the number of the retired population increases. The total number of the older population is projected to increase greatly within the coming decades, with rising proportions of the post-war baby-boom generations reaching retirement. This will cause a high burden on the working age population as they provide for the increasing number of the older population.
The Easterlin hypothesis states that the positive relationship between income and fertility is dependent on relative income. It is considered the first viable and a still leading explanation for mid-twentieth century baby booms.
Fertility factors are determinants of the number of children that an individual is likely to have. Fertility factors are mostly positive or negative correlations without certain causations.
Anatole Romaniuk was a Ukrainian Canadian demographer who contributed to fertility and sterility, African demography, Aboriginal studies, demographic processes, and population forecasting. He played a key role in numerous population censuses, including the first population census in the Democratic Republic of Congo, several censuses in Canada from 1970 through to 1993, and the first census of independent Ukraine (2001).
In recent decades, the fertility rate of the United States has declined below replacement level, prompting projections of an aging population and workforce, as is already happening elsewhere in the developed world and some developing countries. The decline has been most noticeable since after the Great Recession of the late 2000s. Nevertheless, the rate of aging in the United States remains slower than that seen in many other countries, including some developing ones, giving the nation a significant competitive advantage. Unintentional pregnancies have become less common; in particular, teenage pregnancies have dropped to record lows.
Generation Alpha is a social cohort born between the early 2010s and mid 2020s. The birth years of Generation Alpha have seen a decline in birth rates, especially in the developed world.
{{cite journal}}
: Cite journal requires |journal=
(help){{cite journal}}
: Cite journal requires |journal=
(help){{cite journal}}
: Cite journal requires |journal=
(help){{cite journal}}
: CS1 maint: bot: original URL status unknown (link)