Neath | |
---|---|
Former county constituency for the House of Commons | |
Preserved county | West Glamorgan |
Electorate | 57,823 (December 2010) [1] |
Major settlements | Neath, Pontardawe |
1918–2024 | |
Seats | One |
Created from | Mid Glamorganshire and Gower |
Replaced by | Aberafan Maesteg Brecon, Radnor and Cwm Tawe Neath and Swansea East |
Senedd | Neath, South Wales West |
Neath (Welsh : Castell-nedd) was a constituency [n 1] in Wales represented in the House of Commons of the UK Parliament from 1918 to 2024. [n 2]
The constituency was abolished as part of the 2023 Periodic Review of Westminster constituencies and under the June 2023 final recommendations of the Boundary Commission for Wales for the 2024 United Kingdom general election. Its wards are to be split between Aberafan Maesteg , Brecon, Radnor and Cwm Tawe , and Neath and Swansea East . [2]
The constituency was located in the preserved county of West Glamorgan, Wales. It consisted of the electoral wards of: Aberdulais, Allt-wen, Blaengwrach, Bryn-côch North, Bryn-côch South, Cadoxton, Cimla, Crynant, Cwmllynfell, Dyffryn, Glynneath, Godre'r Graig, Gwaun-Cae-Gurwen, Lower Brynamman, Neath East, Neath North, Neath South, Onllwyn, Pelenna, Pontardawe, Resolven, Rhos, Seven Sisters, Tonna, Trebanos and Ystalyfera.
The Neath constituency was a mixture of both industrial and rural communities, running in a north–south strip along the dips, ridges and folded landscape of South Wales. It included most of the Neath and Dulais valleys, and some of the Upper Swansea Valley as well. The town of Neath was at its southern end and is a medium-sized town which started life as a Roman Nidum.
The constituency boasted historical places of both industrial and natural forms. Neath and the surrounding areas were industrialised very early in Britain's history. Copper smelting was already happening here in the late 16th century.[ citation needed ]
When Neath Abbey (now a magnificent ruin) was founded in 1129, it was the richest of all Welsh monasteries, and in writings of the sixteenth century was described as the 'fairest Abbey of all Wales'. At its height it owned extensive lands and property, from Glamorgan to Somerset; had almost 5,000 sheep, as well as horses and cattle; it owned a ship and a landing-place, and worked mills, fisheries and coal-mines. But it suffered greatly during the many skirmishes between the Welsh and English (or Normans), and by the 1530s had only eight monks left. The ruins date mostly from the late thirteenth century. It has been in turn, a prosperous Abbey, a Jacobean Mansion (painted by Turner), an iron foundry (which explains the Abbey's position in the middle of an industrial area) and now an historical monument.
The constituency was heavily mined and the small communities that grew up around these mines were devastated by the collapse of the mining industry in the 1980s. On the edges of many of these communities there are now "Industrial Villages" springing up, helping to replace the jobs lost by the demise of the mining industry, and so helping to keep young people in these communities. [3] [ unreliable source? ]
A legacy to Neath's political history is the memorial stone in Victoria Gardens to the 5 Neath citizens killed during the Spanish Civil War of 1936–38.[ citation needed ]
The constituency remains a Welsh-speaking area, with approximately 26% of the population reported as Welsh speakers.[ citation needed ]
Party | Candidate | Votes | % | ±% | |
---|---|---|---|---|---|
C | Liberal | Hugh Edwards | 17,818 | 64.8 | N/A |
Labour | Herbert Morgan | 9,670 | 35.2 | N/A | |
Majority | 8,148 | 29.6 | N/A | ||
Turnout | 27,488 | 70.6 | N/A | ||
Registered electors | 38,929 | ||||
Liberal win (new seat) | |||||
Cindicates candidate endorsed by the coalition government. |
Party | Candidate | Votes | % | ±% | |
---|---|---|---|---|---|
Labour | William Jenkins | 19,566 | 59.5 | +24.3 | |
National Liberal | Hugh Edwards | 13,331 | 40.5 | -24.3 | |
Majority | 6,235 | 19.0 | N/A | ||
Turnout | 32,897 | 75.4 | +4.8 | ||
Registered electors | 32,897 | ||||
Labour gain from National Liberal | Swing | +24.3 | |||
Party | Candidate | Votes | % | ±% | |
---|---|---|---|---|---|
Labour | William Jenkins | 20,764 | 62.3 | +2.8 | |
Liberal | Thomas Elias | 12,562 | 37.7 | -2.8 | |
Majority | 8,202 | 24.6 | +5.6 | ||
Turnout | 33,326 | 73.9 | -1.5 | ||
Registered electors | 33,326 | ||||
Labour hold | Swing | +2.8 | |||
Party | Candidate | Votes | % | ±% | |
---|---|---|---|---|---|
Labour | William Jenkins | Unopposed | |||
Registered electors | 46,996 | ||||
Labour hold | |||||
Party | Candidate | Votes | % | ±% | |
---|---|---|---|---|---|
Labour | William Jenkins | 29,455 | 60.2 | N/A | |
Liberal | Jack Jones | 14,554 | 29.8 | N/A | |
Unionist | David J. Evans | 4,892 | 10.0 | N/A | |
Majority | 14,901 | 30.4 | N/A | ||
Turnout | 48,901 | 82.1 | N/A | ||
Registered electors | 48,901 | ||||
Labour hold | Swing | N/A | |||
Party | Candidate | Votes | % | ±% | |
---|---|---|---|---|---|
Labour | William Jenkins | 30,873 | 64.0 | +3.8 | |
Liberal | David G Davies | 17,389 | 36.0 | +6.2 | |
Majority | 13,484 | 28.0 | -2.4 | ||
Turnout | 48,262 | 78.4 | -3.7 | ||
Registered electors | 61,550 | ||||
Labour hold | Swing | -1.2 | |||
Party | Candidate | Votes | % | ±% | |
---|---|---|---|---|---|
Labour | William Jenkins | Unopposed | |||
Registered electors | 64,975 | ||||
Labour hold | |||||
Party | Candidate | Votes | % | ±% | |
---|---|---|---|---|---|
Labour | David James Williams | 30,847 | 79.3 | N/A | |
Plaid Cymru | Wynne Samuel | 6,290 | 16.2 | N/A | |
Revolutionary Communist | Jock Haston | 1,781 | 4.6 | N/A | |
Majority | 24,557 | 63.1 | N/A | ||
Turnout | 38,918 | 58.0 | N/A | ||
Registered electors | 67,083 | ||||
Labour hold | Swing | N/A | |||
Party | Candidate | Votes | % | ±% | |
---|---|---|---|---|---|
Labour | David James Williams | 37,957 | 75.8 | N/A | |
National Liberal | David Bowen | 8,466 | 16.9 | N/A | |
Plaid Cymru | Wynne Samuel | 3,659 | 7.3 | N/A | |
Majority | 29,491 | 58.9 | N/A | ||
Turnout | 50,082 | 75.7 | N/A | ||
Registered electors | 67,083 | ||||
Labour hold | Swing | ||||
Party | Candidate | Votes | % | ±% | |
---|---|---|---|---|---|
Labour | David James Williams | 33,034 | 73.0 | -2.8 | |
Conservative | Jack C. Hope | 6,225 | 13.7 | -3.2 | |
Liberal | O Vaughan Jones | 4,425 | 9.8 | N/A | |
Communist | A Thomas | 1,584 | 3.5 | N/A | |
Majority | 26,809 | 59.3 | +0.4 | ||
Turnout | 45,268 | 87.5 | +11.8 | ||
Registered electors | 51,720 | ||||
Labour hold | Swing | ||||
Party | Candidate | Votes | % | ±% | |
---|---|---|---|---|---|
Labour | David James Williams | 34,496 | 76.9 | +3.9 | |
Conservative | Geoffrey Jennings | 10,367 | 23.1 | +9.4 | |
Majority | 24,129 | 53.8 | -5.5 | ||
Turnout | 44,863 | 85.9 | -1.6 | ||
Registered electors | 52,203 | ||||
Labour hold | Swing | ||||
Party | Candidate | Votes | % | ±% | |
---|---|---|---|---|---|
Labour | David James Williams | 30,581 | 76.4 | -0.5 | |
Conservative | Jack C. Hope | 9,467 | 23.6 | +0.5 | |
Majority | 21,114 | 52.8 | -1.0 | ||
Turnout | 40,048 | 77.9 | -8.0 | ||
Registered electors | 51,422 | ||||
Labour hold | Swing | ||||
Party | Candidate | Votes | % | ±% | |
---|---|---|---|---|---|
Labour | David James Williams | 30,469 | 71.4 | -5.0 | |
Conservative | Daniel Norton Idris Pearce | 10,263 | 24.0 | +0.4 | |
Communist | James J. David | 1,962 | 4.6 | N/A | |
Majority | 20,206 | 47.4 | -5.4 | ||
Turnout | 42,694 | 82.6 | +4.7 | ||
Registered electors | 51,711 | ||||
Labour hold | Swing | ||||
Party | Candidate | Votes | % | ±% | |
---|---|---|---|---|---|
Labour | Donald Coleman | 29,692 | 73.4 | +2.0 | |
Conservative | Mervyn Nelson Scorgie | 8,342 | 20.6 | -3.4 | |
Communist | James J. David | 2,432 | 6.0 | +1.4 | |
Majority | 21,350 | 52.8 | +5.4 | ||
Turnout | 41,466 | 80.4 | -2.2 | ||
Registered electors | 50,318 | ||||
Labour hold | Swing | ||||
Party | Candidate | Votes | % | ±% | |
---|---|---|---|---|---|
Labour | Donald Coleman | 31,183 | 79.9 | +6.5 | |
Conservative | Paul H. Valerio | 6,312 | 16.1 | -4.5 | |
Communist | James J. David | 1,632 | 4.2 | -1.8 | |
Majority | 24,871 | 63.8 | +11.0 | ||
Turnout | 39,127 | 78.7 | -1.7 | ||
Registered electors | 49,694 | ||||
Labour hold | Swing | ||||
Party | Candidate | Votes | % | ±% | |
---|---|---|---|---|---|
Labour | Donald Coleman | 28,378 | 71.4 | -8.5 | |
Conservative | David Henry J. Martin-Jones | 6,765 | 17.0 | +0.9 | |
Plaid Cymru | Glyn John | 4,012 | 10.1 | N/A | |
Communist | Bert Pearce | 579 | 1.5 | -2.7 | |
Majority | 21,613 | 54.4 | -9.2 | ||
Turnout | 38,734 | 75.3 | -3.4 | ||
Registered electors | 52,744 | ||||
Labour hold | Swing | ||||
Party | Candidate | Votes | % | ±% | |
---|---|---|---|---|---|
Labour | Donald Coleman | 25,351 | 62.2 | -9.2 | |
Plaid Cymru | H G Evans | 8,758 | 21.5 | +11.4 | |
Conservative | L J Walters | 6,616 | 16.2 | -0.8 | |
Majority | 16,593 | 40.7 | -13.7 | ||
Turnout | 40,725 | 78.5 | +3.2 | ||
Registered electors | 51,887 | ||||
Labour hold | Swing | ||||
Party | Candidate | Votes | % | ±% | |
---|---|---|---|---|---|
Labour | Donald Coleman | 25,028 | 61.4 | -0.8 | |
Plaid Cymru | H G Evans | 7,305 | 17.9 | -3.6 | |
Conservative | M Harris | 4,641 | 11.4 | -4.8 | |
Liberal | D Owen | 3,759 | 9.2 | N/A | |
Majority | 17,723 | 43.5 | +2.8 | ||
Turnout | 40,733 | 77.9 | -0.6 | ||
Registered electors | 52,257 | ||||
Labour hold | Swing | ||||
Party | Candidate | Votes | % | ±% | |
---|---|---|---|---|---|
Labour | Donald Coleman | 27,071 | 64.5 | +3.1 | |
Conservative | C Sandy | 8,455 | 20.1 | +8.7 | |
Plaid Cymru | Aled Gwyn | 6,430 | 15.3 | -2.6 | |
Majority | 18,616 | 44.4 | +0.9 | ||
Turnout | 41,956 | 81.2 | +3.3 | ||
Registered electors | 51,659 | ||||
Labour hold | Swing | ||||
Party | Candidate | Votes | % | ±% | |
---|---|---|---|---|---|
Labour | Donald Coleman | 22,670 | 53.6 | -10.9 | |
SDP | Keith Davies | 9,066 | 21.4 | N/A | |
Conservative | Richard Buckley | 7,350 | 17.4 | -2.7 | |
Plaid Cymru | Ieuan Owen | 3,046 | 7.2 | -8.1 | |
Computer Democrat | J Donavon | 150 | 0.3 | N/A | |
Majority | 13,604 | 32.2 | -12.2 | ||
Turnout | 42,282 | 76.5 | -4.7 | ||
Registered electors | 55,272 | ||||
Labour hold | Swing | ||||
Party | Candidate | Votes | % | ±% | |
---|---|---|---|---|---|
Labour | Donald Coleman | 27,612 | 63.4 | +9.8 | |
Conservative | Martin Howe | 7,034 | 16.1 | -1.3 | |
SDP | John Warman | 6,132 | 14.1 | -7.3 | |
Plaid Cymru | Huw John | 2,792 | 6.4 | -0.8 | |
Majority | 20,578 | 47.3 | +15.1 | ||
Turnout | 43,570 | 78.8 | +2.3 | ||
Registered electors | 55,261 | ||||
Labour hold | Swing | ||||
Party | Candidate | Votes | % | ±% | |
---|---|---|---|---|---|
Labour | Peter Hain | 17,962 | 51.7 | −11.7 | |
Plaid Cymru | Dewi Evans | 8,132 | 23.3 | +16.9 | |
Conservative | Richard Evans | 2,995 | 8.6 | −7.5 | |
Liberal Democrats | David Lloyd | 2,000 | 5.8 | -8.3 | |
SDP | John Warman | 1,826 | 5.3 | N/A | |
Local Independent Labour | Rhys Jeffreys | 1,253 | 3.6 | N/A | |
Monster Raving Loony | David Sutch | 263 | 0.8 | N/A | |
Captain Beany of the Bean Party | Barry Kirk | 262 | 0.7 | N/A | |
Majority | 9,830 | 28.4 | −18.9 | ||
Turnout | 34,753 | 64.0 | −14.8 | ||
Registered electors | 54,482 | ||||
Labour hold | Swing | +2.0 | |||
Party | Candidate | Votes | % | ±% | |
---|---|---|---|---|---|
Labour | Peter Hain | 30,903 | 68.0 | +4.6 | |
Conservative | David R. Adams | 6,928 | 15.2 | −0.9 | |
Plaid Cymru | Dewi R. Evans | 5,145 | 11.3 | +4.9 | |
Liberal Democrats | Michael Phillips | 2,467 | 5.4 | -8.7 | |
Majority | 23,975 | 52.8 | +5.5 | ||
Turnout | 45,443 | 80.6 | +1.8 | ||
Registered electors | 56,392 | ||||
Labour hold | Swing | +2.8 | |||
Party | Candidate | Votes | % | ±% | |
---|---|---|---|---|---|
Labour | Peter Hain | 30,324 | 73.5 | +5.5 | |
Conservative | David M. Evans | 3,583 | 8.7 | −6.5 | |
Plaid Cymru | Trefor Jones | 3,344 | 8.1 | −3.2 | |
Liberal Democrats | Frank H. Little | 2,597 | 6.3 | +0.9 | |
Referendum | Peter A. Morris | 975 | 2.4 | N/A | |
Legalise Cannabis Party | Howard Marks | 420 | 1.0 | N/A | |
Majority | 26,741 | 64.8 | +12.0 | ||
Turnout | 41,243 | 74.3 | -6.3 | ||
Registered electors | 55,541 | ||||
Labour hold | Swing | +6.1 | |||
Party | Candidate | Votes | % | ±% | |
---|---|---|---|---|---|
Labour | Peter Hain | 21,253 | 60.7 | −12.8 | |
Plaid Cymru | Alun Llewelyn | 6,437 | 18.4 | +10.3 | |
Liberal Democrats | Dai Davies | 3,335 | 9.5 | +3.2 | |
Conservative | David Devine | 3,310 | 9.5 | +0.8 | |
Socialist Alliance | Huw Pudner | 483 | 1.4 | N/A | |
ProLife Alliance | Gerry Brienza | 202 | 0.6 | N/A | |
Majority | 14,816 | 42.3 | -22.5 | ||
Turnout | 35,020 | 62.5 | −11.8 | ||
Registered electors | 56,001 | ||||
Labour hold | Swing | -11.5 | |||
Party | Candidate | Votes | % | ±% | |
---|---|---|---|---|---|
Labour | Peter Hain | 18,835 | 52.6 | −8.1 | |
Plaid Cymru | Geraint Owen | 6,125 | 17.1 | −1.3 | |
Liberal Democrats | Sheila Waye | 5,112 | 14.3 | +4.8 | |
Conservative | Harri Davies | 4,136 | 11.5 | +2.0 | |
Green | Susan Jay | 658 | 1.8 | N/A | |
Independent | Gerry Brienza | 360 | 1.0 | N/A | |
Legalise Cannabis | Pat Tabram | 334 | 0.9 | N/A | |
Respect | Heather Falconer | 257 | 0.7 | N/A | |
Majority | 12,710 | 35.5 | -6.8 | ||
Turnout | 35,817 | 62.2 | −0.3 | ||
Registered electors | 57,278 | ||||
Labour hold | Swing | −3.4 | |||
Party | Candidate | Votes | % | ±% | |
---|---|---|---|---|---|
Labour | Peter Hain | 17,172 | 46.3 | −6.3 | |
Plaid Cymru | Alun Llywelyn | 7,397 | 19.9 | +2.8 | |
Liberal Democrats | Frank Little | 5,535 | 14.9 | +0.6 | |
Conservative | Emmeline Owens | 4,847 | 13.1 | +1.6 | |
BNP | Michael Green | 1,342 | 3.6 | N/A | |
UKIP | James Bevan | 829 | 2.2 | N/A | |
Rejected ballots | 67 | ||||
Majority | 9,775 | 26.4 | -9.1 | ||
Turnout | 37,122 | 64.9 | +2.7 | ||
Registered electors | 57,295 | ||||
Labour hold | Swing | −4.6 | |||
Of the 67 rejected ballots:
Party | Candidate | Votes | % | ±% | |
---|---|---|---|---|---|
Labour Co-op | Christina Rees | 16,270 | 43.8 | −2.5 | |
Plaid Cymru | Daniel Thomas | 6,722 | 18.1 | −1.8 | |
UKIP | Richard Pritchard | 6,094 | 16.4 | +14.2 | |
Conservative | Ed Hastie | 5,691 | 15.3 | +2.2 | |
Green | Catrin Brock | 1,185 | 3.2 | N/A | |
Liberal Democrats | Clare Bentley | 1,173 | 3.2 | −11.7 | |
Rejected ballots | 114 | ||||
Majority | 9,548 | 25.7 | −0.7 | ||
Turnout | 37,135 | 66.2 | +1.3 | ||
Registered electors | 56,097 | ||||
Labour Co-op hold | Swing | −0.3 | |||
Of the 114 rejected ballots:
Party | Candidate | Votes | % | ±% | |
---|---|---|---|---|---|
Labour Co-op | Christina Rees | 21,713 | 56.7 | +12.9 | |
Conservative | Orla Lowe | 9,082 | 23.7 | +8.4 | |
Plaid Cymru | Daniel Williams | 5,339 | 13.9 | −4.2 | |
UKIP | Richard Pritchard | 1,419 | 3.7 | −12.7 | |
Liberal Democrats | Frank Little | 732 | 1.9 | −1.3 | |
Rejected ballots | 83 | ||||
Majority | 12,631 | 33.0 | +7.3 | ||
Turnout | 38,285 | 68.5 | +1.3 | ||
Registered electors | 55,862 | ||||
Labour Co-op hold | Swing | +2.2 | |||
Of the 83 rejected ballots:
Party | Candidate | Votes | % | ±% | |
---|---|---|---|---|---|
Labour Co-op | Christina Rees | 15,920 | 43.3 | –13.4 | |
Conservative | Jon Burns | 10,283 | 28.0 | +4.3 | |
Plaid Cymru | Daniel Williams | 4,495 | 12.2 | –1.7 | |
Brexit Party | Simon Briscoe | 3,184 | 8.7 | N/A | |
Liberal Democrats | Andrew Kingston-Jones | 1,485 | 4.0 | +2.1 | |
Green | Megan Lloyd | 728 | 2.0 | N/A | |
Independent | Philip Rogers | 594 | 1.6 | N/A | |
SDP | Carl Williams | 67 | 0.2 | N/A | |
Rejected ballots | 107 | ||||
Majority | 5,637 | 15.3 | –17.7 | ||
Turnout | 36,756 | 65.2 | –3.3 | ||
Registered electors | 56,416 | ||||
Labour Co-op hold | Swing | –8.8 | |||
Of the 107 rejected ballots:
Aberavon is a constituency represented in the House of Commons of the Parliament of the United Kingdom since 2015 by Stephen Kinnock of the Welsh Labour Party. It includes the town of Aberavon, although the largest town in the constituency is Port Talbot.
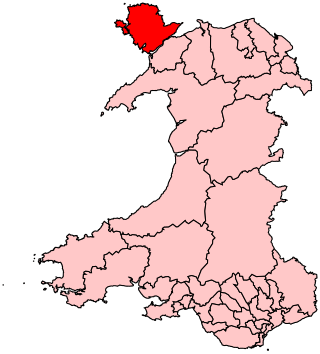
Ynys Môn is a constituency of the House of Commons of the Parliament of the United Kingdom. It elects one Member of Parliament (MP) by the first past the post system of election. It is one of five 'protected constituencies' within the UK, with boundaries defined by the Parliamentary Constituencies Act 2020 to be fixed to those of Isle of Anglesey County Council.
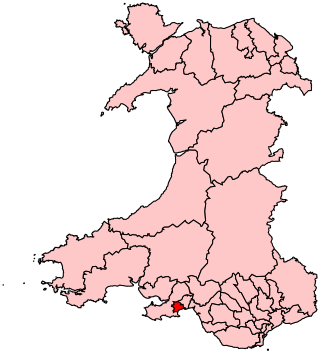
Swansea West is a constituency of the House of Commons of the Parliament of the United Kingdom. It elects one Member of Parliament (MP) by the first past the post system of election, and is currently represented by Geraint Davies of Labour Co-op, who was first elected in the constituency in 2010.
Cardiff North is a constituency represented in the House of Commons of the UK Parliament since 2017 by Anna McMorrin of the Labour Party.
Monmouth was a county constituency of the House of Commons of the Parliament of the United Kingdom. The seat was created for the 1918 general election. From 2005 until 2024 the Member of Parliament (MP) was David Davies of the Conservative Party.
Alyn and Deeside is a parliamentary constituency represented in the House of Commons of the Parliament of the United Kingdom. The constituency was created in 1983, and it elects one Member of Parliament (MP) by the first-past-the-post method of election.
Bridgend is a constituency represented in the House of Commons of the UK Parliament since 2019 by Jamie Wallis, a Conservative.
Caerphilly is a constituency centred on the town of Caerphilly in South Wales, represented in the House of Commons of the UK Parliament since 2001 by Wayne David of the Labour Party.
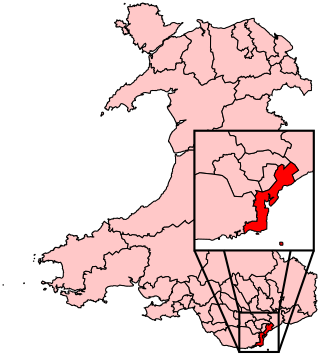
Cardiff South and Penarth is a constituency created in 1983 represented in the House of Commons of the UK Parliament since 2012 by Stephen Doughty, a Labour Co-op MP. It is the largest such entity in Wales, with an electorate of 75,175 and one of the most ethnically diverse.
Cardiff West is a constituency represented in the House of Commons of the UK Parliament since 2001 by Kevin Brennan of the Labour Party.
Clwyd West is a constituency of the House of Commons of the Parliament of the United Kingdom. It elects one Member of Parliament (MP) by the first past the post method of election. The current MP is David Jones of the Conservative Party, first elected at the 2005 general election and who also served as Secretary of State for Wales from 4 September 2012 until 14 July 2014.
Cynon Valley is a constituency in Wales represented in the House of Commons of the UK Parliament since 2019 by Beth Winter of the Labour Party.
Islwyn was a constituency in Wales represented in the House of Commons of the Parliament of the United Kingdom. The area, historically known for coal-mining, has voted for Labour Party candidates since it was created effective at the 1983 general election. Islwyn's first Member of Parliament (MP) was Neil Kinnock, who represented it until he resigned from Parliament in 1995. Kinnock also served as Leader of the Labour Party and Leader of the Opposition from 1983 until 1992.
Llanelli is a constituency of the House of Commons of the Parliament of the United Kingdom. From 1918 to 1970 the official spelling of the constituency name was Llanelly. It elects one Member of Parliament (MP) by the first past the post system of election. Since 2005, it is currently represented by Nia Griffith of the Labour Party.
Merthyr Tydfil and Rhymney was a constituency represented in the House of Commons of the UK Parliament. It was established for the 1983 general election.
Newport East is a constituency in the city of Newport, South Wales, represented in the House of Commons of the UK Parliament since 2005 by Jessica Morden of the Labour Party.
Newport West was one of two parliamentary constituencies for the city of Newport, South Wales, in the House of Commons of the Parliament of the United Kingdom. It elected one Member of Parliament (MP) using the first-past-the-post voting system. Paul Flynn, of the Labour Party, was the MP from the 1987 general election until his death on 17 February 2019. Consequently, a by-election was held in the constituency on Thursday 4 April 2019 and Ruth Jones of the Labour Party was elected.
Preseli Pembrokeshire was a seat and constituency of the House of Commons of the Parliament of the United Kingdom.
Swansea East is a borough constituency represented in the House of Commons of the Parliament of the United Kingdom by Carolyn Harris of the Labour Party.
Wrexham is a parliamentary constituency centred on the city of Wrexham in the preserved county of Clwyd, Wales in the United Kingdom. It was created in 1918, and is represented in the House of Commons of the UK Parliament from December 2019 by Sarah Atherton of the Conservative Party.