Opinion polling on the Arnold Schwarzenegger governorship

Last updated

Opinion polling on the governorship of Arnold Schwarzenegger began after Schwarzenegger was sworn in as Governor of California in 2003 and ended with his second term expiring in 2011.

Political barometers

Polling firmFieldwork dateSample
size
Segment ApproveDisapproveNo opinionNetRef.
StartEnd
Field January 9, 2004January 13, 2004929Registered voters52%27%21%25% [1]
FieldFebruary 18, 2004February 22, 2004958Registered voters56%26%18%30% [2]
FieldMay 18, 2004May 24, 2004745Registered voters65%23%12%42% [3]
FieldJuly 30, 2004August 8, 2004602Registered voters65%22%13%43% [4]
FieldSeptember 24, 2004September 29, 2004600Registered voters65%22%13%43% [5]
PPIC January 11, 2005January 18, 20052,002All adults60%33%7%27% [6]
PPICJanuary 11, 2005January 18, 20051,169Likely voters63%32%5%31% [6]
FieldFebruary 8, 2005February 17, 20051,009All adults54%35%11%19% [7]
FieldFebruary 8, 2005February 17, 2005800Registered voters55%35%10%20% [7]
PPICApril 4, 2005April 17, 20052,502All adults40%50%10%10% [8]
PPICApril 4, 2005April 17, 20051,912Registered voters43%48%9%5% [8]
PPICApril 4, 2005April 17, 20051,405Likely voters45%47%8%2% [8]
PPICMay 10, 2005May 17, 20052,003All adults40%49%11%9% [9]
PPICMay 10, 2005May 17, 20051,171Likely voters45%46%9%1% [9]
FieldJune 13, 2005June 19, 2005954All adults31%58%11%27% [10]
FieldJune 13, 2005June 19, 2005711Registered voters37%53%10%16% [10]
PPICJune 28, 2005July 12, 20052,502All adults34%51%15%17% [11]
PPICJune 28, 2005July 12, 20051,390Likely voters41%49%10%8% [11]
PPICAugust 8, 2005August 15, 20052,004All adults34%54%12%20% [12]
PPICAugust 8, 2005August 15, 2005998Likely voters41%50%9%9% [12]
PPICSeptember 12, 2005September 19, 20052,004All adults33%58%9%25% [13]
PPICSeptember 12, 2005September 19, 20051,572Registered voters35%57%8%22% [13]
PPICSeptember 12, 2005September 19, 20051,013Likely voters38%55%7%17% [13]
PPICOctober 16, 2005October 23, 20052,003All adults33%58%9%25% [14]
PPICOctober 16, 2005October 23, 20051,580Registered voters34%56%10%22% [14]
PPICOctober 16, 2005October 23, 20051,079Likely voters38%57%5%21% [14]
PPICNovember 9, 2005November 20, 20052,002 Special election voters39%56%5%17% [15]
PPICNovember 30, 2005December 13, 20052,504All adults32%58%10%26% [16]
PPICJanuary 11, 2006January 18, 20062,003All adults40%52%8%12% [17]
PPICJanuary 11, 2006January 18, 20061,602Registered voters43%50%7%7% [17]
PPICJanuary 11, 2006January 18, 20061,193Likely voters45%48%7%3% [17]
PPICFebruary 8, 2006February 15, 20062,003All adults35%53%12%18% [18]
PPICFebruary 8, 2006February 15, 20061,128Likely voters40%50%10%10% [18]
PPICMarch 15, 2006March 22, 20062,002All adults37%52%11%15% [19]
PPICMarch 15, 2006March 22, 20061,008Likely voters47%45%8%2% [19]
PPICApril 4, 2006April 19, 20062,501All adults38%50%12%12% [20]
PPICApril 4, 2006April 19, 20061,137Likely voters46%44%10%2% [20]
PPICMay 14, 2006May 21, 20062,000All adults36%52%12%16% [21]
PPICMay 14, 2006May 21, 2006986Likely voters42%48%10%6% [21]
PPICJuly 5, 2006July 18, 20062,501All adults42%44%14%2% [22]
PPICJuly 5, 2006July 18, 20061,225Likely voters49%43%8%6% [22]
PPICAugust 16, 2006August 23, 20062,001All adults44%46%10%2% [23]
PPICAugust 16, 2006August 23, 2006989Likely voters50%42%8%8% [23]
PPICSeptember 13, 2006September 20, 20062,003All adults46%46%8%0% [24]
PPICSeptember 13, 2006September 20, 20061,091Likely voters53%39%8%14% [24]
PPICOctober 15, 2006October 22, 20062,002All adults47%45%8%2% [25]
PPICOctober 15, 2006October 22, 20061,076Likely voters52%41%7%11% [25]
PPICNovember 8, 2006November 19, 20062,000 General election voters60%32%8%28% [26]
PPICJanuary 11, 2007January 18, 20072,014All adults58%32%10%26% [27]
PPICJanuary 11, 2007January 18, 20071,180Likely voters61%30%9%31% [27]
PPICMarch 13, 2007March 20, 20072,000All adults51%38%11%13% [28]
PPICMarch 13, 2007March 20, 20071,122Likely voters56%34%10%22% [28]
PPICApril 3, 2007April 17, 20072,500All adults53%34%13%19% [29]
PPICApril 3, 2007April 17, 20071,410Likely voters62%30%8%32% [29]
PPICMay 15, 2007May 22, 20072,005All adults53%34%13%19% [30]
PPICMay 15, 2007May 22, 2007986Likely voters61%29%10%32% [30]
PPICJune 12, 2007June 19, 20072,003All adults57%31%12%26% [31]
PPICJune 12, 2007June 19, 2007983Likely voters65%24%11%41% [31]
PPICJune 28, 2007July 15, 20072,500All adults52%34%14%18% [32]
PPICJune 28, 2007July 15, 20071,238Likely voters59%31%10%28% [32]
PPICSeptember 4, 2007September 11, 20072,003All adults50%38%12%12% [33]
PPICSeptember 4, 2007September 11, 20071,045Likely voters59%31%10%28% [33]
PPICOctober 10, 2007October 23, 20072,503All adults51%37%12%14% [34]
PPICOctober 10, 2007October 23, 20071,447Likely voters59%32%9%27% [34]
PPICNovember 27, 2007December 4, 20072,002All adults57%37%6%20% [35]
PPICNovember 27, 2007December 4, 20071,015Likely voters63%31%6%32% [35]
PPICJanuary 13, 2008January 20, 20082,000All adults50%44%6%6% [36]
PPICJanuary 13, 2008January 20, 20081,099Likely voters52%42%6%10% [36]
PPICMarch 11, 2008March 18, 20082,002All adults44%49%7%5% [37]
PPICMarch 11, 2008March 18, 20081,077Likely voters49%45%6%4% [37]
PPICApril 8, 2008April 22, 20082,502All adults41%48%11%7% [38]
PPICApril 8, 2008April 22, 20081,406Likely voters45%44%11%1% [38]
PPICMay 12, 2008May 18, 20082,003All adults41%51%8%10% [39]
PPICMay 12, 2008May 18, 20081,086Likely voters45%49%6%4% [39]
PPICJuly 8, 2008July 22, 20082,504All adults43%45%12%2% [40]
PPICJuly 8, 2008July 22, 20081,401Likely voters49%42%9%7% [40]
PPICAugust 12, 2008August 19, 20082,003All adults38%56%6%18% [41]
PPICAugust 12, 2008August 19, 20081,047Likely voters43%52%5%9% [41]
PPICSeptember 9, 2008September 16, 20082,002All adults38%55%7%17% [42]
PPICSeptember 9, 2008September 16, 20081,157Likely voters42%51%7%9% [42]
PPICOctober 12, 2008October 19, 20082,004All adults39%54%7%15% [43]
PPICOctober 12, 2008October 19, 20081,186Likely voters47%48%5%1% [43]
PPICOctober 20, 2008November 3, 20082,503All adults40%50%10%10% [44]
PPICOctober 20, 2008November 3, 20081,526Likely voters45%46%9%1% [44]
PPICNovember 5, 2008November 16, 20082,003 General election voters42%49%9%7% [45]
PPICJanuary 13, 2009January 20, 20092,001All adults40%51%9%11% [46]
PPICJanuary 13, 2009January 20, 20091,277Likely voters44%46%10%2% [46]
PPICFebruary 3, 2009February 17, 20092,502All adults33%56%11%23% [47]
PPICMarch 10, 2009March 17, 20092,004All adults32%56%12%24% [48]
PPICMarch 10, 2009March 17, 2009987Likely voters33%57%10%24% [48]
PPICApril 7, 2009April 21, 20092,502All adults32%55%13%23% [49]
PPICApril 7, 2009April 21, 20091,518Likely voters34%55%11%21% [49]
PPICApril 27, 2009May 4, 20092,005All adults34%53%13%19% [50]
PPICApril 27, 2009May 4, 20091,080Likely voters34%56%10%22% [50]
PPICJuly 7, 2009July 21, 20092,501All adults28%59%13%31% [51]
PPICJuly 7, 2009July 21, 20091,457Likely voters29%61%10%32% [51]
PPICAugust 26, 2009September 2, 20092,006All adults30%61%9%31% [52]
PPICAugust 26, 2009September 2, 20091,291Likely voters33%58%9%25% [52]
PPICOctober 20, 2009November 3, 20092,502All adults28%60%12%32% [53]
PPICOctober 20, 2009November 3, 20091,488Likely voters27%64%9%37% [53]
PPICDecember 1, 2009December 8, 20092,004All adults27%60%13%33% [54]
PPICDecember 1, 2009December 8, 2009963Likely voters30%60%10%30% [54]
PPICJanuary 12, 2010January 19, 20102,001All adults30%60%10%30% [55]
PPICJanuary 12, 2010January 19, 20101,223Likely voters32%59%9%27% [55]
FieldMarch 9, 2010March 15, 2010503Registered voters23%71%6%48% [56]
PPICMarch 9, 2010March 16, 20102,002All adults24%64%12%30% [57]
PPICMarch 9, 2010March 16, 20101,102Likely voters25%64%11%29% [57]
PPICApril 6, 2010April 20, 20102,504All adults24%64%12%30% [58]
PPICApril 6, 2010April 20, 20101,439Likely voters26%65%9%29% [58]
PPICMay 9, 2010May 16, 20102,003All adults23%65%12%32% [59]
PPICMay 9, 2010May 16, 20101,168Likely voters24%66%10%32% [59]
PPICJuly 6, 2010July 20, 20102,502All adults25%62%13%37% [60]
PPICJuly 6, 2010July 20, 20101,321Likely voters25%66%9%41% [60]
PPICSeptember 19, 2010September 26, 20102,004All adults28%64%8%36% [61]
PPICSeptember 19, 2010September 26, 20101,104Likely voters28%66%6%38% [61]
PPICOctober 10, 2010October 17, 20102,002All adults28%65%7%37% [62]
PPICOctober 10, 2010October 17, 20101,067Likely voters29%65%6%36% [62]
PPICOctober 19, 2010November 2, 20102,502All adults25%62%13%37% [63]
PPICOctober 19, 2010November 2, 20101,551Likely voters27%63%10%36% [63]
PPICNovember 3, 2010November 14, 20102,003 General election voters32%61%7%29% [64]

Related Research Articles

<span class="mw-page-title-main">2003 California gubernatorial recall election</span>

The 2003 California gubernatorial recall election was a special election permitted under California state law. It resulted in voters replacing incumbent Democratic Governor Gray Davis with Republican Arnold Schwarzenegger. The recall effort spanned the latter half of 2003. Seven of the nine previous governors, including Davis, had faced unsuccessful recall attempts.

<span class="mw-page-title-main">Cruz Bustamante</span> American politician

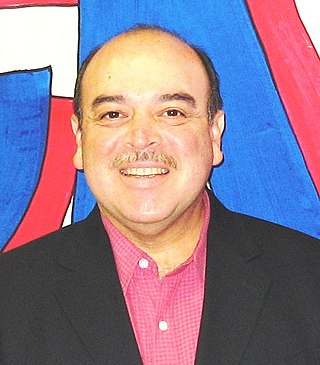
Cruz Miguel Bustamante is an American politician. He previously served as the 45th Lieutenant Governor of California from 1999 to 2007, serving under governors Gray Davis and Arnold Schwarzenegger. A member of the Democratic Party, Bustamante also served in the California State Assembly and served as the Speaker from 1996 to 1998.

<span class="mw-page-title-main">1978 California Proposition 13</span> Ballot initiative which capped property tax at 1% and yearly increases at 2%

Proposition 13 is an amendment of the Constitution of California enacted during 1978, by means of the initiative process. The initiative was approved by California voters on June 6, 1978 by a nearly two to one margin. It was upheld as constitutional by the United States Supreme Court in the case of Nordlinger v. Hahn, 505 U.S. 1 (1992). Proposition 13 is embodied in Article XIII A of the Constitution of the State of California.

<span class="mw-page-title-main">2006 California gubernatorial election</span>

The 2006 California gubernatorial election occurred on November 7, 2006. The primary elections took place on June 6, 2006. The incumbent Republican Governor, Arnold Schwarzenegger, won re-election for his first and only full term. His main opponent was California State Treasurer Phil Angelides, the California Democratic Party nominee. Peter Camejo was the California Green Party nominee, Janice Jordan was the Peace and Freedom Party nominee, Art Olivier was the California Libertarian Party nominee, and Edward C. Noonan was the California American Independent Party nominee.

<span class="mw-page-title-main">Governorship of Arnold Schwarzenegger</span>

The governorship of Arnold Schwarzenegger began in 2003, when Arnold Schwarzenegger ran for Governor of California in a recall election. He was subsequently elected Governor when the previous governor Gray Davis was recalled and Schwarzenegger placed first among replacement candidates. Schwarzenegger served the remainder of Davis' incomplete term between 2003 and 2007. Schwarzenegger was then reelected to a second term in 2006, serving out this full term and leaving office in January 2011. Schwarzenegger was unable to run for a third term due to term limits imposed by the Constitution of California.

<span class="mw-page-title-main">2008 California Proposition 4</span> Failed ballot proposition on abortion

Proposition 4, or the Abortion Waiting Period and Parental Notification Initiative, also known to its supporters as Sarah's Law, was an initiative state constitutional amendment in the 2008 California general election.

<span class="mw-page-title-main">2008 California Proposition 11</span>

Proposition 11 of 2008 was a law enacted by California voters that placed the power to draw electoral boundaries for State Assembly and State Senate districts in a Citizens Redistricting Commission, as opposed to the State Legislature. To do this the Act amended both the Constitution of California and the Government Code. The law was proposed by means of the initiative process and was put to voters as part of the November 4, 2008 state elections. In 2010, voters passed Proposition 20 which extended the Citizen Redistricting Commission's power to draw electoral boundaries to include U.S. House seats as well.

<span class="mw-page-title-main">2009 California elections</span>

The California state special elections, 2009 were held on May 19, 2009 throughout the state of California. The elections were authorized by the State Legislature and Governor Arnold Schwarzenegger as a part of a budget signed into law on February 19, 2009. Voters voted on six ballot propositions, 1A through 1F, for the open 26th State Senate district seat, and in a primary for the open 32nd congressional district seat. All of the propositions except 1F were defeated.

Kenneth P. Miller is a professor of Government at Claremont McKenna College, specializing in state politics, policy, and law. Miller is the Director of the Rose Institute of State and Local Government, a research institute known for its expertise in redistricting, elections, demographic research, polling, and public policy analysis. He has written extensively on state politics and policy, direct democracy, constitutional law, courts, and political polarization.

<span class="mw-page-title-main">Tani Cantil-Sakauye</span> American judge

Tani Gorre Cantil-Sakauye is an American lawyer and jurist who was the 28th Chief Justice of California and is the president/CEO of the Public Policy Institute of California. She was nominated by Governor Arnold Schwarzenegger to serve as chief justice on July 22, 2010, and retained in office by California voters on November 2, 2010, she was sworn in on January 3, 2011 as California's first Filipino and first woman of color to serve as California's Chief Justice. Prior to her appointment as chief justice, Cantil-Sakauye had served in judicial offices on California's appellate and trial courts. On July 27, 2022, she announced she would retire and not run for another 12 year term on the court in November and step down on January 1, 2023, leaving Governor Newsom to appoint her replacement. On September 28, 2022, the Public Policy Institute of California announced that Cantil-Sakauye would become its president and chief executive officer, effective January 1, 2023. On September 21, 2023, the Judicial Council of California voted unanimously to name the new Sacramento County courthouse after former Chief Justice Tani Cantil-Sakauye.

<span class="mw-page-title-main">2010 California Proposition 19</span> Failed measure to legalize marijuana

California Proposition 19 was a ballot initiative on the November 2, 2010, statewide ballot. It was defeated, with 53.5% of California voters voting "No" and 46.5% voting "Yes." If passed, it would have legalized various marijuana-related activities, allowed local governments to regulate these activities, permitted local governments to impose and collect marijuana-related fees and taxes, and authorized various criminal and civil penalties. In March 2010, it qualified to be on the November statewide ballot. The proposition required a simple majority in order to pass, and would have taken effect the day after the election. Yes on 19 was the official advocacy group for the initiative and California Public Safety Institute: No On Proposition 19 was the official opposition group.

<span class="mw-page-title-main">Statewide opinion polling for the 2016 Republican Party presidential primaries</span>

This article contains opinion polling by U.S. state for the 2016 Republican Party presidential primaries. The shading for each poll indicates the candidate(s) which are within one margin of error of the poll's leader.

<span class="mw-page-title-main">Statewide opinion polling for the 2016 Democratic Party presidential primaries</span>

This article contains opinion polling by U.S. state for the 2016 Democratic Party presidential primaries. For currency and accuracy, please note the specific dates for each polling as listed below. For the significance of the earliest state votes, the Iowa caucuses and the New Hampshire primary, see United States presidential primary – Iowa and New Hampshire. To know when any given state votes, see the timeline of primaries and caucuses.

<span class="mw-page-title-main">Statewide opinion polling for the 2016 United States presidential election</span> Research done to predict the outcome of the 2016 presidential election

Statewide polls for the 2016 United States presidential election include the following. The polls listed here provide early data on opinion polling between the Democratic candidate, the Republican candidate, the Libertarian candidate, and the Green candidate. Prior to the parties' conventions, presumptive candidates were included in the polls. State polling is not conducted in all states for the election due to various factors. More polls usually are conducted in states that are considered swing states as more attention is given to the results. For determining a statistical tie, the margin of error provided by the polling source is applied to the result for each candidate.

<span class="mw-page-title-main">2016 California Democratic presidential primary</span>

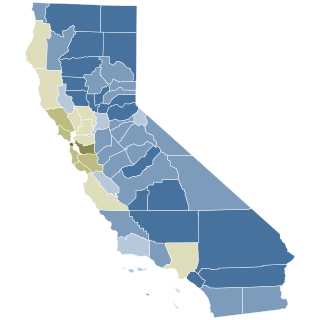
The 2016 California Democratic presidential primary was held on June 7 in the U.S. state of California as one of the Democratic Party's primaries ahead of the 2016 presidential election.

Statewide polls for the 2016 United States presidential election are as follows. The polls listed here, by state, are from January 1 to August 31, 2016 and provide early data on opinion polling between a possible Republican candidate against a possible Democratic candidate.

This article summarizes the results of polls taken during the presidency of Donald Trump which gather and analyze public opinion on his administration's performance and policies.

This is a list of opinion polls taken on the Presidency of Donald Trump in 2018.

This is a list of opinion polls taken on the presidency of Donald Trump in 2019. Polls throughout the year showed that more disapproved of Trump than approved of him, generally by a margin of between five and fifteen percentage points. The polls also showed that the margin may have been stronger or weaker in some states, when compared with the national polls.

References

  1. DiCamillo, Mark; Field, Mervin (January 15, 2004). "Schwarzenegger viewed positively, but voters expect a tax increase. They support either hiking sales taxes ½ cent or increasing income taxes of top earners, but oppose the governor's $15 billion bond" (PDF). Field Research Corporation. Archived from the original (PDF) on June 23, 2016. Retrieved July 22, 2019.
  2. DiCamillo, Mark; Field, Mervin (February 24, 2004). "Schwarzenegger after 100 days: high approval ratings. Voters see him as doing what is right over what is politically popular. Views contrast sharply with those held about his predecessor" (PDF). Field Research Corporation. Archived from the original (PDF) on June 23, 2016. Retrieved July 22, 2019.
  3. DiCamillo, Mark; Field, Mervin (May 27, 2004). "Schwarzenegger gets high job approval rating. Voters expect state finances to improve next year but believe taxes will need to be raised" (PDF). Field Research Corporation. Archived from the original (PDF) on June 23, 2016. Retrieved July 22, 2019.
  4. DiCamillo, Mark; Field, Mervin (August 10, 2004). "Voters continue to give governor very high job approval marks; rate his budget performance better than the legislature. But, majority opposes the idea of a part-time legislature" (PDF). Field Research Corporation. Archived from the original (PDF) on June 23, 2016. Retrieved July 22, 2019.
  5. DiCamillo, Mark; Field, Mervin (October 8, 2004). "Schwarzenegger continues to get high marks. But, Californians would not support him if he were able to run for president" (PDF). Field Research Corporation. Archived from the original (PDF) on June 23, 2016. Retrieved July 22, 2019.
  6. 1 2 "PPIC Statewide Survey January 2005" (PDF). Public Policy Institute of California. Archived (PDF) from the original on April 4, 2018. Retrieved January 2, 2018.
  7. 1 2 DiCamillo, Mark; Field, Mervin (February 23, 2005). "While Schwarzenegger still viewed favorably, big drop in his job appraisal from last year" (PDF). Field Research Corporation. Archived from the original (PDF) on June 23, 2016. Retrieved July 22, 2019.
  8. 1 2 3 "PPIC Statewide Survey April 2005" (PDF). Public Policy Institute of California. Archived (PDF) from the original on May 4, 2015. Retrieved January 2, 2018.
  9. 1 2 "PPIC Statewide Survey May 2005" (PDF). Public Policy Institute of California. Archived (PDF) from the original on May 4, 2015. Retrieved January 2, 2018.
  10. 1 2 DiCamillo, Mark; Field, Mervin (June 21, 2005). "Schwarzenegger's job ratings hit a new low. Voters oppose the governor's call for a special election. State legislature not highly regarded, but voters more likely to side with it against the governor" (PDF). Field Research Corporation. Archived from the original (PDF) on June 23, 2016. Retrieved August 4, 2019.
  11. 1 2 "PPIC Statewide Survey July 2005" (PDF). Public Policy Institute of California. Archived (PDF) from the original on May 4, 2015. Retrieved January 2, 2018.
  12. 1 2 "PPIC Statewide Survey August 2005" (PDF). Public Policy Institute of California. Archived (PDF) from the original on September 10, 2016. Retrieved January 2, 2018.
  13. 1 2 3 "PPIC Statewide Survey September 2005" (PDF). Public Policy Institute of California. Archived (PDF) from the original on May 4, 2015. Retrieved January 2, 2018.
  14. 1 2 3 "PPIC Statewide Survey October 2005" (PDF). Public Policy Institute of California. Archived (PDF) from the original on May 4, 2015. Retrieved January 2, 2018.
  15. "PPIC Statewide Survey November 2005" (PDF). Public Policy Institute of California. Archived (PDF) from the original on May 4, 2015. Retrieved January 2, 2018.
  16. "PPIC Statewide Survey December 2005" (PDF). Public Policy Institute of California. Archived (PDF) from the original on March 28, 2016. Retrieved January 2, 2018.
  17. 1 2 3 "PPIC Statewide Survey January 2006" (PDF). Public Policy Institute of California. Archived (PDF) from the original on April 4, 2018. Retrieved January 2, 2018.
  18. 1 2 "PPIC Statewide Survey February 2006" (PDF). Public Policy Institute of California. Archived (PDF) from the original on May 4, 2015. Retrieved January 2, 2018.
  19. 1 2 "PPIC Statewide Survey March 2006" (PDF). Public Policy Institute of California. Archived (PDF) from the original on May 25, 2017. Retrieved January 2, 2018.
  20. 1 2 "PPIC Statewide Survey April 2006" (PDF). Public Policy Institute of California. Archived (PDF) from the original on May 25, 2017. Retrieved January 2, 2018.
  21. 1 2 "PPIC Statewide Survey May 2006" (PDF). Public Policy Institute of California. Archived (PDF) from the original on November 26, 2020. Retrieved July 6, 2019.
  22. 1 2 "PPIC Statewide Survey July 2006" (PDF). Public Policy Institute of California. Archived (PDF) from the original on June 14, 2019. Retrieved July 6, 2019.
  23. 1 2 "PPIC Statewide Survey August 2006" (PDF). Public Policy Institute of California. Archived (PDF) from the original on October 26, 2020. Retrieved July 10, 2019.
  24. 1 2 "PPIC Statewide Survey September 2006" (PDF). Public Policy Institute of California. Archived (PDF) from the original on October 26, 2020. Retrieved July 12, 2019.
  25. 1 2 "PPIC Statewide Survey October 2006" (PDF). Public Policy Institute of California. Archived (PDF) from the original on October 26, 2020. Retrieved July 12, 2019.
  26. "PPIC Statewide Survey November 2006" (PDF). Public Policy Institute of California. Archived (PDF) from the original on February 28, 2021. Retrieved July 12, 2019.
  27. 1 2 "PPIC Statewide Survey January 2007" (PDF). Public Policy Institute of California. Archived (PDF) from the original on January 19, 2021. Retrieved July 12, 2019.
  28. 1 2 "PPIC Statewide Survey March 2007" (PDF). Public Policy Institute of California. Archived (PDF) from the original on September 28, 2020. Retrieved July 12, 2019.
  29. 1 2 "PPIC Statewide Survey April 2007" (PDF). Public Policy Institute of California. Archived (PDF) from the original on December 31, 2018. Retrieved July 12, 2019.
  30. 1 2 "PPIC Statewide Survey May 2007" (PDF). Public Policy Institute of California. Archived (PDF) from the original on September 28, 2020. Retrieved July 12, 2019.
  31. 1 2 "PPIC Statewide Survey June 2007" (PDF). Public Policy Institute of California. Archived (PDF) from the original on November 25, 2019. Retrieved July 12, 2019.
  32. 1 2 "PPIC Statewide Survey July 2007" (PDF). Public Policy Institute of California. Archived (PDF) from the original on July 12, 2019. Retrieved July 12, 2019.
  33. 1 2 "PPIC Statewide Survey September 2007" (PDF). Public Policy Institute of California. Archived (PDF) from the original on June 11, 2019. Retrieved July 12, 2019.
  34. 1 2 "PPIC Statewide Survey October 2007" (PDF). Public Policy Institute of California. Archived (PDF) from the original on March 28, 2016. Retrieved July 12, 2019.
  35. 1 2 "PPIC Statewide Survey December 2007" (PDF). Public Policy Institute of California. Archived (PDF) from the original on January 27, 2017. Retrieved July 12, 2019.
  36. 1 2 "PPIC Statewide Survey January 2008" (PDF). Public Policy Institute of California. Archived (PDF) from the original on September 28, 2020. Retrieved July 12, 2019.
  37. 1 2 "PPIC Statewide Survey March 2008" (PDF). Public Policy Institute of California. Archived (PDF) from the original on December 2, 2018. Retrieved July 12, 2019.
  38. 1 2 "PPIC Statewide Survey April 2008" (PDF). Public Policy Institute of California. Archived (PDF) from the original on February 26, 2021. Retrieved July 12, 2019.
  39. 1 2 "PPIC Statewide Survey May 2008" (PDF). Public Policy Institute of California. Archived (PDF) from the original on September 28, 2020. Retrieved July 12, 2019.
  40. 1 2 "PPIC Statewide Survey July 2008" (PDF). Public Policy Institute of California. Archived (PDF) from the original on July 12, 2019. Retrieved July 12, 2019.
  41. 1 2 "PPIC Statewide Survey August 2008" (PDF). Public Policy Institute of California. Archived (PDF) from the original on June 26, 2019. Retrieved July 12, 2019.
  42. 1 2 "PPIC Statewide Survey September 2008" (PDF). Public Policy Institute of California. Archived (PDF) from the original on July 3, 2019. Retrieved July 12, 2019.
  43. 1 2 "PPIC Statewide Survey October 2008" (PDF). Public Policy Institute of California. Archived (PDF) from the original on June 18, 2019. Retrieved July 12, 2019.
  44. 1 2 "PPIC Statewide Survey November 2008" (PDF). Public Policy Institute of California. Archived (PDF) from the original on October 19, 2016. Retrieved July 12, 2019.
  45. "PPIC Statewide Survey December 2008" (PDF). Public Policy Institute of California. Archived (PDF) from the original on September 12, 2019. Retrieved July 12, 2019.
  46. 1 2 "PPIC Statewide Survey January 2009" (PDF). Public Policy Institute of California. Archived (PDF) from the original on October 26, 2020. Retrieved July 12, 2019.
  47. "PPIC Statewide Survey February 2009" (PDF). Public Policy Institute of California. Archived (PDF) from the original on April 7, 2019. Retrieved July 12, 2019.
  48. 1 2 "PPIC Statewide Survey March 2009" (PDF). Public Policy Institute of California. Archived (PDF) from the original on September 28, 2020. Retrieved July 12, 2019.
  49. 1 2 "PPIC Statewide Survey April 2009" (PDF). Public Policy Institute of California. Archived (PDF) from the original on September 28, 2020. Retrieved July 22, 2019.
  50. 1 2 "PPIC Statewide Survey May 2009" (PDF). Public Policy Institute of California. Archived (PDF) from the original on September 28, 2020. Retrieved July 22, 2019.
  51. 1 2 "PPIC Statewide Survey July 2009" (PDF). Public Policy Institute of California. Archived (PDF) from the original on June 14, 2019. Retrieved July 22, 2019.
  52. 1 2 "PPIC Statewide Survey September 2009" (PDF). Public Policy Institute of California. Archived (PDF) from the original on August 11, 2019. Retrieved July 22, 2019.
  53. 1 2 "PPIC Statewide Survey November 2009" (PDF). Public Policy Institute of California. Archived (PDF) from the original on April 26, 2021. Retrieved July 22, 2019.
  54. 1 2 "PPIC Statewide Survey December 2009" (PDF). Public Policy Institute of California. Archived (PDF) from the original on October 8, 2018. Retrieved July 22, 2019.
  55. 1 2 "PPIC Statewide Survey January 2010" (PDF). Public Policy Institute of California. Archived (PDF) from the original on November 7, 2018. Retrieved July 22, 2019.
  56. DiCamillo, Mark; Field, Mervin (March 21, 2010). "Voter ratings of Schwarzenegger and State Legislature equal historic lows" (PDF). Field Research Corporation. Archived from the original (PDF) on June 23, 2016. Retrieved July 22, 2019.
  57. 1 2 "PPIC Statewide Survey March 2010" (PDF). Public Policy Institute of California. Archived (PDF) from the original on September 28, 2020. Retrieved July 22, 2019.
  58. 1 2 "PPIC Statewide Survey April 2010" (PDF). Public Policy Institute of California. Archived (PDF) from the original on December 31, 2018. Retrieved July 22, 2019.
  59. 1 2 "PPIC Statewide Survey May 2010" (PDF). Public Policy Institute of California. Archived (PDF) from the original on June 14, 2019. Retrieved July 22, 2019.
  60. 1 2 "PPIC Statewide Survey July 2010" (PDF). Public Policy Institute of California. Archived (PDF) from the original on August 17, 2019. Retrieved July 22, 2019.
  61. 1 2 "PPIC Statewide Survey September 2010" (PDF). Public Policy Institute of California. Archived (PDF) from the original on June 14, 2019. Retrieved July 22, 2019.
  62. 1 2 "PPIC Statewide Survey October 2010" (PDF). Public Policy Institute of California. Archived (PDF) from the original on May 2, 2019. Retrieved July 22, 2019.
  63. 1 2 "PPIC Statewide Survey November 2010" (PDF). Public Policy Institute of California. Archived (PDF) from the original on December 31, 2018. Retrieved July 22, 2019.
  64. "PPIC Statewide Survey December 2010" (PDF). Public Policy Institute of California. Archived (PDF) from the original on December 1, 2017. Retrieved July 22, 2019.