Pandora FMS

Last updated
Pandora FMS
Original author(s) Sancho Lerena Urrea [1]
Developer(s) Pandora FMS
Initial releaseOctober 14, 2004 (2004-10-14)
Stable release
7.0 NG 772 LTS "Renaissance" [2] / June 20, 2023;3 months ago (2023-06-20)
Repository
Written in Perl, PHP, C++, JavaScript
Operating system Linux, Windows
Available inEnglish, Spanish, Japanese, Russian, Chinese, Portuguese, Italian, Polish, German, French, Arabic
Type Network monitoring, System monitoring
License GNU General Public License or proprietary EULA
Website pandorafms.com

Pandora FMS (for Pandora Flexible Monitoring System) is software for monitoring computer networks. [3] Pandora FMS allows monitoring in a visual way the status and performance of several parameters from different operating systems, servers, applications and hardware systems such as firewalls, proxies, databases, web servers or routers.

Contents

Pandora FMS can be deployed in almost any operating system. It features remote monitoring (WMI, SNMP, TCP, UDP, ICMP, HTTP...) and it can also use agents. An agent is available for each platform. It can also monitor hardware systems with a TCP/IP stack, such as load balancers, routers, network switches, printers or firewalls.

Pandora FMS has several servers that process and get information from different sources, using WMI for gathering remote Windows information, a predictive server, a plug-in server which makes complex user-defined network tests, an advanced export server to replicate data between different sites of Pandora FMS, a network discovery server, and an SNMP Trap console.

Released under the terms of the GNU General Public License, Pandora FMS is free software. At first the project was hosted on SourceForge.net, from where it has been downloaded over one million times, [4] and selected the “Staff Pick” Project of the Month, June 2016, [5] and elected “Community Choice” Project of the Month, November 2017. [6]

Components

Arch-schema.png

Pandora Server

In Pandora FMS architecture, servers are the core of the system because they are the recipients of bundles of information. They also generate monitoring alerts. It is possible to have different modular configurations for the servers: several servers for very big systems, or just a single server. Servers are also responsible for inserting the gathered data into Pandora's database. It is possible to have several Pandora Servers connected to a single Database. Different servers are used for different kind of monitoring: remote monitoring, WMI monitoring, SNMP and other network monitoring, inventory recollection, etc. Highly scalable (up to 2000 nodes with one single server), completely web-driven and a multitenant interface. It has a very flexible ACL system and a lot of graphical reports and user-defined control screens. [7]

Servers are developed in Perl and work on any platform that has the required modules. Pandora was originally developed for Linux.

Web console

Pandora's user interface allows people to operate and manage the monitoring system. It is developed in PHP and depends on a database and a web server. It can work in a wide range of platforms: Linux, Solaris, Windows, AIX and others. Several web consoles can be deployed in the same system if required. Web Console has multiples choices, in example SNMP monitoring.

Agents

Agents are daemons or services that can monitor any numeric parameter, Boolean status, string or numerical incremental data and/or condition. They can be developed in any language (as Shellscript, WSH, Perl or C). They run on any type of platform (Microsoft, AIX, Solaris, Linux, IPSO, Mac OS or FreeBSD), also SAP, because the agents can communicate with the Pandora FMS Servers to send data in XML using SSH, FTP, NFS, Tentacle (protocol) or any data transfer means.

Database

The database module is the core module of Pandora. All the information of the system resides here. For example, all data gathered by agents, configuration defined by administrator, events, incidents, audit info, etc. are stored in the database. At present, MySQL database and MariaDB database [8] is supported. Oracle support has been added in 6.0 release.

Software appliances

Pandora FMS has a software appliance based on a customized CentOS Linux, installable on CD, comes ready to use (including a live CD) or ready to install to hard disk.

It have also an AMI Appliance based on Amazon AWS.

A Docker image is also available at Docker Hub.

See also

Related Research Articles

Simple Network Management Protocol (SNMP) is an Internet Standard protocol for collecting and organizing information about managed devices on IP networks and for modifying that information to change device behaviour. Devices that typically support SNMP include cable modems, routers, switches, servers, workstations, printers, and more.

<span class="mw-page-title-main">Cacti (software)</span> Free open source RRDtool

Cacti is an open-source, web-based network monitoring, performance, fault and configuration management framework designed as a front-end application for the open-source, industry-standard data logging tool RRDtool. Cacti allows a user to poll services at predetermined intervals and graph the resulting data. Through the use of Cacti plugins, it has been extended to encompass all of the FCAPS operational management categories. It is generally used to graph time-series data of metrics such as CPU load and network bandwidth utilization. A common usage is to monitor network traffic by polling a network switch or router interface via Simple Network Management Protocol (SNMP).

Windows Management Instrumentation (WMI) consists of a set of extensions to the Windows Driver Model that provides an operating system interface through which instrumented components provide information and notification. WMI is Microsoft's implementation of the Web-Based Enterprise Management (WBEM) and Common Information Model (CIM) standards from the Distributed Management Task Force (DMTF).

Nagios Core, formerly known as Nagios, is a free and open-source computer-software application that monitors systems, networks and infrastructure. Nagios offers monitoring and alerting services for servers, switches, applications and services. It alerts users when things go wrong and alerts them a second time when the problem has been resolved.

<span class="mw-page-title-main">Multi Router Traffic Grapher</span>

The Multi Router Traffic Grapher (MRTG) is free software for monitoring and measuring the traffic load on network links. It allows the user to see traffic load on a network over time in graphical form.

The Intelligent Platform Management Interface (IPMI) is a set of computer interface specifications for an autonomous computer subsystem that provides management and monitoring capabilities independently of the host system's CPU, firmware and operating system. IPMI defines a set of interfaces used by system administrators for out-of-band management of computer systems and monitoring of their operation. For example, IPMI provides a way to manage a computer that may be powered off or otherwise unresponsive by using a network connection to the hardware rather than to an operating system or login shell. Another use case may be installing a custom operating system remotely. Without IPMI, installing a custom operating system may require an administrator to be physically present near the computer, insert a DVD or a USB flash drive containing the OS installer and complete the installation process using a monitor and a keyboard. Using IPMI, an administrator can mount an ISO image, simulate an installer DVD, and perform the installation remotely.

A dedicated hosting service, dedicated server, or managed hosting service is a type of Internet hosting in which the client leases an entire server not shared with anyone else. This is more flexible than shared hosting, as organizations have full control over the server(s), including choice of operating system, hardware, etc.

The Desktop Management Interface (DMI) generates a standard framework for managing and tracking components in a desktop, notebook or server computer, by abstracting these components from the software that manages them. The development of DMI, 2.0 version June 24, 1998, marked the first move by the Distributed Management Task Force (DMTF) into desktop-management standards. Before the introduction of DMI, no standardized source of information could provide details about components in a personal computer.

IBM Storage Protect is a data protection platform that gives enterprises a single point of control and administration for backup and recovery. It is the flagship product in the IBM Spectrum Protect family.

Net-SNMP is a suite of software for using and deploying the SNMP protocol. It supports IPv4, IPv6, IPX, AAL5, Unix domain sockets and other transports. It contains a generic client library, a suite of command line applications, a highly extensible SNMP agent, perl modules and python modules.

<span class="mw-page-title-main">Zenoss</span>

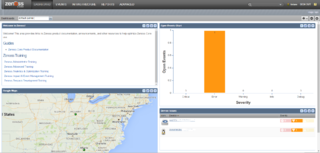
The company Zenoss, Inc. was founded in 2005 and is headquartered in Austin, Texas. The company develops hybrid IT monitoring and analytics software.

OpenNMS is a free and open-source enterprise grade network monitoring and network management platform. It is developed and supported by a community of users and developers and by the OpenNMS Group, offering commercial services, training and support.

<span class="mw-page-title-main">NetXMS</span>

NetXMS is an multi-platform open-source network management system. It can be used for monitoring entire IT infrastructures, starting with SNMP-capable hardware and ending with applications on servers.

<span class="mw-page-title-main">Shinken (software)</span> Network monitoring software

Shinken is an open source computer system and network monitoring software application compatible with Nagios. It watches hosts and services, gathers performance data and alerts users when error conditions occur and again when the conditions clear.

<span class="mw-page-title-main">Icinga</span> Monitoring software

Icinga is an open-source computer system and network monitoring application. It was originally created as a fork of the Nagios system monitoring application in 2009.

Checkmk is a software developed in Python and C++ for IT Infrastructure monitoring. It is used for the monitoring of servers, applications, networks, cloud infrastructures, containers, storage, databases and environment sensors.

<span class="mw-page-title-main">XigmaNAS</span> Software

XigmaNAS is network-attached storage (NAS) server software with a dedicated management web interface. It is free software under the terms of the Simplified BSD license.

OpenLMI provides a common management infrastructure for Linux systems. Available operations include configuration of various operating system parameters and services, hardware components configuration, and monitoring of system resources. Services provided by OpenLMI can be accessed both locally and remotely, using multiple programming languages and standardized APIs.

<span class="mw-page-title-main">Prometheus (software)</span> Application used for event monitoring and alerting

Prometheus is a free software application used for event monitoring and alerting. It records metrics in a time series database built using an HTTP pull model, with flexible queries and real-time alerting. The project is written in Go and licensed under the Apache 2 License, with source code available on GitHub, and is a graduated project of the Cloud Native Computing Foundation, along with Kubernetes and Envoy.

<span class="mw-page-title-main">Paessler PRTG</span> Network monitoring software

PRTG is an agentless network monitoring software from Paessler AG. Several software versions are combined under the umbrella term Paessler PRTG. It is designed to monitor and classify system conditions like bandwidth usage or uptime and collect statistics from miscellaneous hosts such as switches, routers, servers, and other devices and applications.

References

  1. "Home". Sancho Lerena. Retrieved 29 August 2023.
  2. "Pandora FMS NG (7.x) released versions". Pandora FMS. 2023-08-20. Retrieved 2023-08-29. Here on you can see the full version note list of all Pandora FMS NG (7.x) released versions. In version notes, we describe through a summary their changes and also name each and every one of them for better comprehension.
  3. Cottrel, Less (19 September 2017). "Network Monitoring Tools". Network Monitoring Platforms (NMPs). slac.stanford.edu. Retrieved 19 September 2017.
  4. "Pandora FMS - Download Statistics". SourceForge.net . 30 November 2018. Archived from the original (html) on 30 November 2018. Retrieved 30 November 2018. Downloads 1,086,185 2014-08-30 to 2018-11-30 Countries Top: US, at 34% Operating Systems Top: Other, at 59%
  5. "June 2016, "Staff Pick" Project of the Month – Pandora FMS". SourceForge.net . 3 June 2016. Archived from the original (html) on 3 June 2016. Retrieved 30 November 2018. For our June "Staff Pick" Project of the Month, we selected Pandora FMS, a flexible monitoring system ready for big environments. Sancho Lerena and Axel Amigo, the people behind the project shared some thoughts about the project's history, purpose, and direction.
  6. "November 2017, "Community Choice" Project of the Month – Pandora FMS". SourceForge.net . 1 November 2017. Archived from the original (html) on 1 November 2017. Retrieved 20 November 2018. Pandora FMS was previously selected "Staff Pick" Project of the Month in June of 2016 where the Pandora team spoke about the project's developments and direction. Recently we caught up with project founder Sancho Lerena to find out how the project has been doing since then.
  7. Ishikawa, Mutsumi (18 September 2017). "Pandora FMS: Flexible Monitoring System". Downloads. OSD.net. Retrieved 25 September 2017.
  8. Raj (9 August 2017). "How to Install PandoraFMS Server on CentOS 7 / RHEL 7 – Monitoring Solution for your Infrastructure". IT'zGeek. Archived from the original on 20 September 2017. Retrieved 24 October 2017. Pandora FMS is a flexible monitoring solution for your servers, networks, virtual infrastructure, and applications. It is a Free software and released under GNU General Public License.