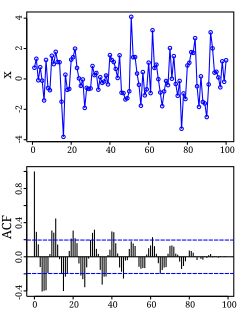
Autocorrelation, sometimes known as serial correlation in the discrete time case, is the correlation of a signal with a delayed copy of itself as a function of delay. Informally, it is the similarity between observations of a random variable as a function of the time lag between them. The analysis of autocorrelation is a mathematical tool for finding repeating patterns, such as the presence of a periodic signal obscured by noise, or identifying the missing fundamental frequency in a signal implied by its harmonic frequencies. It is often used in signal processing for analyzing functions or series of values, such as time domain signals.

In statistics, a normal distribution or Gaussian distribution is a type of continuous probability distribution for a real-valued random variable. The general form of its probability density function is
The likelihood function is the joint probability of the observed data viewed as a function of the parameters of the chosen statistical model.
In statistical mechanics, the Fokker–Planck equation is a partial differential equation that describes the time evolution of the probability density function of the velocity of a particle under the influence of drag forces and random forces, as in Brownian motion. The equation can be generalized to other observables as well.

In statistics, the logistic model is a statistical model that models the probability of an event taking place by having the log-odds for the event be a linear combination of one or more independent variables. In regression analysis, logistic regression is estimating the parameters of a logistic model. Formally, in binary logistic regression there is a single binary dependent variable, coded by an indicator variable, where the two values are labeled "0" and "1", while the independent variables can each be a binary variable or a continuous variable. The corresponding probability of the value labeled "1" can vary between 0 and 1, hence the labeling; the function that converts log-odds to probability is the logistic function, hence the name. The unit of measurement for the log-odds scale is called a logit, from logistic unit, hence the alternative names. See § Background and § Definition for formal mathematics, and § Example for a worked example.

An instanton is a notion appearing in theoretical and mathematical physics. An instanton is a classical solution to equations of motion with a finite, non-zero action, either in quantum mechanics or in quantum field theory. More precisely, it is a solution to the equations of motion of the classical field theory on a Euclidean spacetime.
In statistics, a generalized linear model (GLM) is a flexible generalization of ordinary linear regression. The GLM generalizes linear regression by allowing the linear model to be related to the response variable via a link function and by allowing the magnitude of the variance of each measurement to be a function of its predicted value.
Variational Bayesian methods are a family of techniques for approximating intractable integrals arising in Bayesian inference and machine learning. They are typically used in complex statistical models consisting of observed variables as well as unknown parameters and latent variables, with various sorts of relationships among the three types of random variables, as might be described by a graphical model. As typical in Bayesian inference, the parameters and latent variables are grouped together as "unobserved variables". Variational Bayesian methods are primarily used for two purposes:
- To provide an analytical approximation to the posterior probability of the unobserved variables, in order to do statistical inference over these variables.
- To derive a lower bound for the marginal likelihood of the observed data. This is typically used for performing model selection, the general idea being that a higher marginal likelihood for a given model indicates a better fit of the data by that model and hence a greater probability that the model in question was the one that generated the data.
Weighted least squares (WLS), also known as weighted linear regression, is a generalization of ordinary least squares and linear regression in which knowledge of the variance of observations is incorporated into the regression. WLS is also a specialization of generalized least squares.
In statistics, binomial regression is a regression analysis technique in which the response has a binomial distribution: it is the number of successes in a series of independent Bernoulli trials, where each trial has probability of success . In binomial regression, the probability of a success is related to explanatory variables: the corresponding concept in ordinary regression is to relate the mean value of the unobserved response to explanatory variables.

The softmax function, also known as softargmax or normalized exponential function, converts a vector of K real numbers into a probability distribution of K possible outcomes. It is a generalization of the logistic function to multiple dimensions, and used in multinomial logistic regression. The softmax function is often used as the last activation function of a neural network to normalize the output of a network to a probability distribution over predicted output classes, based on Luce's choice axiom.
In many-body theory, the term Green's function is sometimes used interchangeably with correlation function, but refers specifically to correlators of field operators or creation and annihilation operators.
In probability theory and statistics, the normal-gamma distribution is a bivariate four-parameter family of continuous probability distributions. It is the conjugate prior of a normal distribution with unknown mean and precision.
In mathematics – specifically, in stochastic analysis – an Itô diffusion is a solution to a specific type of stochastic differential equation. That equation is similar to the Langevin equation used in physics to describe the Brownian motion of a particle subjected to a potential in a viscous fluid. Itô diffusions are named after the Japanese mathematician Kiyosi Itô.
The partition function or configuration integral, as used in probability theory, information theory and dynamical systems, is a generalization of the definition of a partition function in statistical mechanics. It is a special case of a normalizing constant in probability theory, for the Boltzmann distribution. The partition function occurs in many problems of probability theory because, in situations where there is a natural symmetry, its associated probability measure, the Gibbs measure, has the Markov property. This means that the partition function occurs not only in physical systems with translation symmetry, but also in such varied settings as neural networks, and applications such as genomics, corpus linguistics and artificial intelligence, which employ Markov networks, and Markov logic networks. The Gibbs measure is also the unique measure that has the property of maximizing the entropy for a fixed expectation value of the energy; this underlies the appearance of the partition function in maximum entropy methods and the algorithms derived therefrom.
The Swendsen–Wang algorithm is the first non-local or cluster algorithm for Monte Carlo simulation for large systems near criticality. It has been introduced by Robert Swendsen and Jian-Sheng Wang in 1987 at Carnegie Mellon.
The Generalized Additive Model for Location, Scale and Shape (GAMLSS) is an approach to statistical modelling and learning. GAMLSS is a modern distribution-based approach to (semiparametric) regression. A parametric distribution is assumed for the response (target) variable but the parameters of this distribution can vary according to explanatory variables using linear, nonlinear or smooth functions. In machine learning parlance, GAMLSS is a form of supervised machine learning.
In probability theory, tau-leaping, or τ-leaping, is an approximate method for the simulation of a stochastic system. It is based on the Gillespie algorithm, performing all reactions for an interval of length tau before updating the propensity functions. By updating the rates less often this sometimes allows for more efficient simulation and thus the consideration of larger systems.
In statistics, the class of vector generalized linear models (VGLMs) was proposed to enlarge the scope of models catered for by generalized linear models (GLMs). In particular, VGLMs allow for response variables outside the classical exponential family and for more than one parameter. Each parameter can be transformed by a link function. The VGLM framework is also large enough to naturally accommodate multiple responses; these are several independent responses each coming from a particular statistical distribution with possibly different parameter values.
In premixed turbulent combustion, Bray–Moss–Libby (BML) model is a closure model for a scalar field, built on the assumption that the reaction sheet is infinitely thin compared with the turbulent scales, so that the scalar can be found either at the state of burnt gas or unburnt gas. The model is named after Kenneth Bray, J. B. Moss and Paul A. Libby.


