Rotorua (New Zealand electorate)

Last updated

Rotorua
Single-member constituency
for the New Zealand House of Representatives
Rotorua electorate, 2014.svg
Location of Rotoruawithin Bay of Plenty
Region Bay of Plenty
Major settlements Rotorua
Current constituency
Current MP Todd McClay
Party National

Rotorua is a New Zealand parliamentary electorate, returning one Member of Parliament to the New Zealand House of Representatives. It was first established in 1919, and has existed continuously since 1954. The current MP for Rotorua is Todd McClay of the National Party, [1] who won the electorate in the 2008 general election from incumbent Labour MP Steve Chadwick.

Contents

Population centres

In the 1918 electoral redistribution, the North Island gained a further three electorates from the South Island due to faster population growth. Only two existing electorates were unaltered, five electorates were abolished, two former electorate were re-established, and three electorates, including Rotorua, were created for the first time. [2]

The initial electorate, which was formed through the 1918 electoral redistribution, had a long coastline along the Bay of Plenty, and incorporated, beside Rotorua, the towns and villages of Whakatāne, Taupō, Tokoroa, Putāruru, Mangakino, Edgecumbe, Tāneatua, and Murupara. [3] In the 1922 electoral redistribution, the electorate lost some area to the Bay of Plenty electorate, and a larger area to the Waikato electorate. [4] The 1927 electoral redistribution saw Rotorua become landlocked, with the Tauranga electorate taking the coastline including Tāneatua and Edgecumbe, and Whakatāne going to the Bay of Plenty electorate. The electorate moved south and took in Lake Taupō, with Tūrangi just beyond the southern boundary located in the Waimarino electorate. The electorate also grew in the north-west, gaining the town of Matamata. [5]

In the 1937 electoral redistribution, the electorate shifted further south again. Matamata was lost again, and the peaks of Tongariro, Ngauruhoe, and Ruapehu now formed the boundary to the Waimarino electorate. [6] The 1946 electoral redistribution saw the Rotorua electorate abolished, with the Bay of Plenty electorate moving west and incorporating the town of Rotorua, most of the southern area going to the Waimarino electorate including the town of Taupō, and some area in the north-west going to the Waikato electorate including Tokoroa. [7]

The First Labour Government was defeated in the 1949 election and the incoming National Government changed the Electoral Act, with the electoral quota once again based on total population as opposed to qualified electors, and the tolerance was increased to 7.5% of the electoral quota. There was no adjustments in the number of electorates between the South and North Islands, but the law changes resulted in boundary adjustments to almost every electorate through the 1952 electoral redistribution; only five electorates were unaltered. [8] Five electorates were reconstituted (including Rotorua) and one was newly created, and a corresponding six electorates were abolished; all of these in the North Island. [9] These changes took effect with the 1954 election. [10] The electorate was again landlocked and much smaller than prior to its abolition. Significant settlements included Rotorua, Tokoroa, Taupō, and Mangakino, with Lake Taupō forming the southern boundary. [11]

Demographics

Over forty per cent of the population of Rotorua is under the age of thirty, much of this because 37% of the electorate's residents are Māori, who are on the whole younger than the national average (22.7 years old versus a national average of 35.9). [12] There are also fewer voters earning over $30,000 per year, with the majority of workers coming from working class and semi-skilled professionals. Rotorua also has more unemployed people (6.5%) than most electorates, being ranked 52nd in the nation.

The country quota applied until 1945 and the Rotorua electorate was initially classed as fully rural. Based on the 1926 New Zealand census, the 1927 Electoral Redistribution determined that 24% of the electorate's population was urban. Based on the 1936 census, the 1937 Electoral Redistribution determined that 36% of the electorate's population was urban. [13]

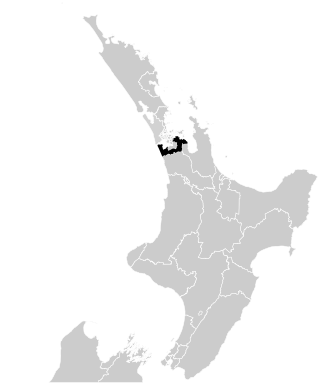
The current Rotorua electorate is positioned in the Bay of Plenty region in the central North Island. It is dominated by the town of Rotorua, and also contains the Eastern Bay of Plenty towns of Kawerau, Murupara and Galatea, the last two of which are located on the outskirts of Te Urewera National Park. In 2008, its boundaries were extended to the geographical bay, with the addition of coastline stretching from a cluster of rural towns including Pukehina and Maketu to the outskirts of Te Puke.

History

An electorate based around Rotorua has been a part of the New Zealand electoral landscape since the 1919 election, with a gap from 1946 to 1954. Previously the town of Rotorua was in the East Coast electorate (from 1871), then the East Coast electorate again (from 1890), then the Bay of Plenty electorate (from 1893), and then (just) in the Tauranga electorate again (from 1911 to 1919). [14]

William Henry Wackrow was nominated in March 1922 as the opposition candidate for that year's election. [15] Wackrow withdrew in November [16] and was replaced by Cecil Clinkard, who lost against the incumbent, Frank Hockly of the Reform Party. [17]

Geoffrey Sim of the National Party won the 1943 election. When the Rotorua electorate was abolished for the 1946 election, Sim successfully stood in Waikato electorate instead. [18]

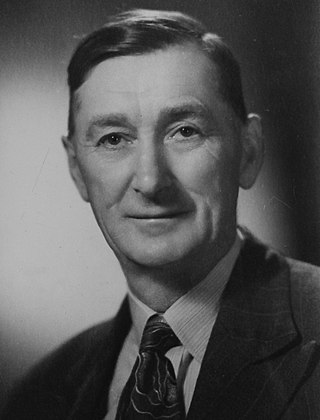
After the electorate was re-established through the 1952 Electoral Redistribution, Ray Boord of the Labour Party won the 1954 election. [19] Boord served two parliamentary terms and was beaten by National's Harry Lapwood in the 1960 election. [20] Lapwood served for six parliamentary terms and retired in 1978. [21]

Lapwood was succeeded by his party colleague Paul East in the 1978 election. East also served six parliamentary terms until 1996. With the advent of Mixed Member Proportional (MMP) voting in 1996, the Rotorua electorate was greatly expanded to include areas previously part of the Eastern Bay of Plenty and Tarawera electorates. Both Tarawera and Rotorua were safe National Party electorates, and in the ensuing battle for the nomination, the two incumbents, East and Max Bradford, faced off for a Rotorua nomination eventually secured by Bradford, with East securing a high list position. [22]

Bradford won the 1996 election with a nearly 6,000 votes margin. [23] Despite both electorates being reasonably loyal to the National Party, Bradford's tenure as MP for Rotorua was just three years, before being ousted by Labour MP Steve Chadwick in the 1999 election. Chadwick's initial majority of 4,978 votes blew out to over 7,500 in 2002 before it was reined in to just 662 in 2005, as the National Party consolidated the centre-right vote, with its biggest gains being in the provincial North Island. In 2005, Chadwick's party was less popular than their candidate, coming 1,645 votes behind National.

In 2008 Chadwick was defeated by National candidate Todd McClay who won the electorate with a majority of 5,067 votes. In the 2011 election McClay again returned as the member for Rotorua, increasing his majority to 7,357 votes. In 2014, McClay was elected as MP for a third term beating television personality Tāmati Coffey by a similar majority to that in the previous election.

Rotorua is also an electorate where the New Zealand First party does well, with its biggest appeal among provincial New Zealanders, and as results in 1996 indicate, Māori: in the three most recent elections, New Zealand First has polled around three per cent higher in Rotorua than it did in the rest of New Zealand.

Members of Parliament

Unless otherwise stated, all MPs terms began and ended at general elections.

Key

  Reform   United   Labour   National

ElectionWinner
1919 election Frank Hockly
1922 election
1925 election
1928 election Cecil Clinkard
1931 election
1935 election Alexander Moncur
1938 election
1943 election Geoffrey Sim
(Electorate abolished 1946–1954, see
Bay of Plenty, Waimarino, and Waikato)
1954 election Ray Boord
1957 election
1960 election Harry Lapwood
1963 election
1966 election
1969 election
1972 election
1975 election
1978 election Paul East
1981 election
1984 election
1987 election
1990 election
1993 election
1996 election Max Bradford
1999 election Steve Chadwick
2002 election
2005 election
2008 election Todd McClay
2011 election
2014 election
2017 election
2020 election
2023 election

List MPs

Members of Parliament elected from party lists in elections where that person also unsuccessfully contested the Rotorua electorate. Unless otherwise stated, all MPs terms began and ended at general elections.

ElectionWinner
1999 election Max Bradford
2008 election Steve Chadwick
2014 election Fletcher Tabuteau
2017 election

Election results

2023 election

2023 general election: Rotorua [24]
Notes:

Blue background denotes the winner of the electorate vote.
Pink background denotes a candidate elected from their party list.
Yellow background denotes an electorate win by a list member, or other incumbent.
A Green check.svgY or Red x.svgN denotes status of any incumbent, win or lose respectively.

PartyCandidateVotes%±%Party votes%±%
National Green check.svgY Todd McClay 19,33952.95+9.6615,31741.36+12.71
Labour Ben Sandford 10,41628.52-12.578,92224.09-22.59
Te Pāti Māori Merepeka Raukawa-Tait 2,7317.488512.30+1.39
ACT Marten Rozeboom1,7324.74+1.933,5439.57+0.51
NewZeal Kariana Black-Vercoe1,2523.43+2.444911.33+0.87 [lower-alpha 1]
Independent John Naera3540.97
Green  2,8857.79+3.04
NZ First  2,8357.66+4.04
Opportunities  6381.72+1.25
New Zealand Loyal  6181.67
Freedoms NZ  2330.63
Legalise Cannabis  1770.48+0.01
DemocracyNZ  1070.29
Animal Justice  540.15
New Conservative  500.14-1.70
New Nation  350.09
Women's Rights  330.09
Leighton Baker Party  280.08
Informal votes700216
Total valid votes36,52437,033
National holdMajority8,92324.43+22.23

2020 election

2020 general election: Rotorua [25]
Notes:

Blue background denotes the winner of the electorate vote.
Pink background denotes a candidate elected from their party list.
Yellow background denotes an electorate win by a list member, or other incumbent.
A Green check.svgY or Red x.svgN denotes status of any incumbent, win or lose respectively.

PartyCandidateVotes%±%Party votes%±%
National Green check.svgY Todd McClay 16,21243.29-10.0810,95128.65-19.68
Labour Claire Mahon 15,38741.09+10.1717,84546.68+14.38
Green Kaya Sparke1,8875.04+0.801,8164.75+0.61
NZ First Fletcher Tabuteau 1,4123.77-4.931,3833.62-6.28
ACT Pete Kirkwood1,0532.813,4639.06+8.73
New Conservative Alan Tāne Solomon5641.51+1.197031.84+1.57
Advance NZ Kiri Ward5631.505181.36
ONE Kari-Ann Varcoe3720.991770.46
Opportunities  6061.59-1.12
Māori Party  3470.91-0.35
Legalise Cannabis  1790.47+0.15
Vision NZ  1410.37
Outdoors  500.13+0.07
Sustainable NZ  210.05
Social Credit  160.04+0.02
TEA  80.02
Heartland  40.01
Informal votes701260
Total valid votes37,45038,228
National holdMajority8252.20-20.25

2017 election

2017 general election: Rotorua [26]
Notes:

Blue background denotes the winner of the electorate vote.
Pink background denotes a candidate elected from their party list.
Yellow background denotes an electorate win by a list member, or other incumbent.
A Green check.svgY or Red x.svgN denotes status of any incumbent, win or lose respectively.

PartyCandidateVotes%±%Party votes%±%
National Green check.svgY Todd McClay 18,78853.37-2.4217,39048.33-3.54
Labour Ben Sandford 10,88730.92-2.7511,62232.3+11.21
NZ First Fletcher Tabuteau 3,0628.70+1.353,5619.90-2.26
Green Richard Gillies1,4914.241,4884.14-2.58
Māori Party Wendy Biddle7021.994541.26-0.17
Independent Rachel Clark1620.46
Conservative Owen Patterson1140.32-1.5970.27-3.73
Opportunities  9742.71
ACT  1200.33-0.09
Legalise Cannabis  1160.32-0.15
Ban 1080  660.18-0.12
People's Party  300.08
Outdoors  230.06
United Future  190.05-0.16
Democrats  80.02-0.03
Internet  80.02-0.78 [lower-alpha 2]
Mana  80.02-0.78 [lower-alpha 3]
Informal votes379133
Total valid votes35,58536,117
National holdMajority7,90122.45+0.34

2014 election

2014 general election: Rotorua [27]
Notes:

Blue background denotes the winner of the electorate vote.
Pink background denotes a candidate elected from their party list.
Yellow background denotes an electorate win by a list member, or other incumbent.
A Green check.svgY or Red x.svgN denotes status of any incumbent, win or lose respectively.

PartyCandidateVotes%±%Party votes%±%
National Green check.svgY Todd McClay 18,14555.79−1.3817,66051.87+0.60
Labour Tāmati Coffey 11,29733.67+1.547,18121.09−0.86
NZ First Fletcher Tabuteau 2,4667.35+0.284,13912.16+1.61
Conservative Michael Davidson6101.82−1.131,3614.00+0.99
ACT Lyall Russell1320.39+0.391420.42−0.43
Green  2,2896.72−1.85
Māori Party  4861.43+0.15
Internet Mana  2720.80−0.24
Legalise Cannabis  1600.47−0.03
Ban 1080  1010.30+0.30
United Future  720.21−0.61
Independent Coalition  330.10+0.10
Democrats  160.05+0.01
Civilian  110.03+0.03
Focus  40.01+0.01
Informal votes328122
Total valid votes33,54834,049
National holdMajority7,41822.11−1.93

2011 election

2011 general election: Rotorua [28]
Notes:

Blue background denotes the winner of the electorate vote.
Pink background denotes a candidate elected from their party list.
Yellow background denotes an electorate win by a list member, or other incumbent.
A Green check.svgY or Red x.svgN denotes status of any incumbent, win or lose respectively.

PartyCandidateVotes%±%Party votes%±%
National Green check.svgY Todd McClay 17,18856.17+2.2616,15951.27+0.92
Labour Steve Chadwick 9,83132.13-6.356,91921.95-8.08
NZ First Fletcher Tabuteau 2,1667.08+7.083,32610.55+4.21
Conservative Daryl Smith9032.95+2.959483.01+3.01
Mana Grant Rogers5101.67+1.673271.04+1.04
Green  2,7008.57+3.58
Māori Party  4041.28-0.50
ACT  2690.85-1.78
United Future  2580.82-0.02
Legalise Cannabis  1590.50+0.06
Libertarianz  190.06+0.02
Alliance  150.05-0.05
Democrats  140.04+0.02
Informal votes835307
Total valid votes30,59831,517
National holdMajority7,35724.04+8.62

Electorate (as at 26 November 2011): 42,886 [29]

2008 election

2008 general election: Rotorua [30]
Notes:

Blue background denotes the winner of the electorate vote.
Pink background denotes a candidate elected from their party list.
Yellow background denotes an electorate win by a list member, or other incumbent.
A Green check.svgY or Red x.svgN denotes status of any incumbent, win or lose respectively.

PartyCandidateVotes%±%Party votes%±%
National Todd McClay 17,70053.91+15.3116,83650.35+8.46
Labour Red x.svgN Steve Chadwick 12,63538.48-2.2910,04430.04-6.63
Green Raewyn Saville1,6655.07+1.361,6664.98+1.21
Kiwi Daryl Smith3651.11+1.111830.55+0.55
United Future Arthur Solomon2410.73-6.222820.84-2.12
RAM Grant Rogers1450.44+0.44240.07+0.07
Libertarianz Fred Stevens820.25+0.25150.04+0.01
NZ First  2,1226.35-2.89
ACT  8792.63+1.44
Māori Party  5961.78+0.22
Progressive  2000.60-0.26
Family Party  1930.58+0.58
Bill and Ben  1860.56+0.56
Legalise Cannabis  1470.44+0.18
Alliance  330.10+0.03
Pacific  130.04+0.04
Workers Party  80.02+0.02
Democrats  70.02-0.03
RONZ  40.01-0.02
Informal votes364154
Total valid votes32,83333,438
National gain from Labour Majority5,06515.43+13.25

2005 election

2005 general election: Rotorua [31]
Notes:

Blue background denotes the winner of the electorate vote.
Pink background denotes a candidate elected from their party list.
Yellow background denotes an electorate win by a list member, or other incumbent.
A Green check.svgY or Red x.svgN denotes status of any incumbent, win or lose respectively.

PartyCandidateVotes%±%Party votes%±%
Labour Green check.svgY Steve Chadwick 12,42040.77-10.6311,35036.67-0.96
National Gil Stehbens11,75838.60+14.8812,96541.89+21.46
United Future Russell Judd2,1196.96+1.639162.96-4.12
NZ First Fletcher Tabuteau 2,0556.75-2.532,8609.24-7.21
Green Raewyn Saville1,1313.71-0.141,1683.77-2.13
Destiny Elaine Herbert6041.98+1.983971.28+1.28
ACT Carl Peterson3781.24+1.243671.19-4.15
Māori Party  4841.56+1.56
Progressive  2670.86-0.69
Legalise Cannabis  830.23-0.66
Alliance  200.06-0.83
Christian Heritage  160.05-1.18
Democrats  160.05+0.05
Libertarianz  100.03+0.03
Family Rights  90.03+0.03
RONZ  90.03+0.03
Direct Democracy  70.02+0.02
One NZ  50.02-0.05
99 MP  40.01+0.01
Informal votes326125
Total valid votes30,46530,950
Labour holdMajority6622.17-25.51

2002 election

2002 general election: Rotorua [32]
Notes:

Blue background denotes the winner of the electorate vote.
Pink background denotes a candidate elected from their party list.
Yellow background denotes an electorate win by a list member, or other incumbent.
A Green check.svgY or Red x.svgN denotes status of any incumbent, win or lose respectively.

PartyCandidateVotes%±%Party votes%±%
Labour Green check.svgY Steve Chadwick 1438051.40+1.701070037.63-0.80
National Malcolm Short663623.72-8.88580920.43-10.30
NZ First Fletcher Tabuteau 25959.28+5.60467716.45+10.64
United Future Russell Judd14905.33+5.3320147.08+7.08
Green Richard Kake10783.85-0.3716795.90+0.61
NZ Equal Rights PartyCliff Lee8062.88+0.07
Christian Heritage Ross Prichard3911.40-0.863501.23-1.19
Independent Reg Turner2320.83+0.83
Progressive David Espin1940.69+0.694421.55+1.55
Alliance Julie Poupard1750.63-1.752520.89-5.98
ACT  15185.34-0.48
ORNZ  7912.78+2.78
Legalise Cannabis  1560.55-0.53
Mana Māori  280.10-0.09
One NZ  190.07-0.03
NMP  10.00-0.01
Informal votes335114
Total valid votes2797728436
Labour holdMajority774427.68+10.59

1999 election

1999 general election: Rotorua [33] [34]
Notes:

Blue background denotes the winner of the electorate vote.
Pink background denotes a candidate elected from their party list.
Yellow background denotes an electorate win by a list member, or other incumbent.
A Green check.svgY or Red x.svgN denotes status of any incumbent, win or lose respectively.

PartyCandidateVotes%±%Party votes%±%
Labour Steve Chadwick 14,47449.7011,29938.42+15.27
National Red x.svgN Max Bradford 9,49632.60-8.109,03730.73-5.31
Green Lynne Dempsey1,2304.221,5575.29
NZ First Robert Dixon1,0703.671,7085.81-12.37
NZ Equal Rights PartyCliff Lee8192.81
Alliance Pirihira Kaio6922.382,0186.86-2.90
Christian Heritage Ross Prichard6572.267132.42-1.99
Christian Democrats Andrew James Parr6192.135361.82
Natural Law Martin Sharp680.23270.09+0.02
ACT  1,7105.82+1.12
Legalise Cannabis  3161.07-0.33
United NZ  1440.49-0.09
Libertarianz  1270.43+0.42
Animals First  550.19+0.02
Mana Māori  540.18+0.11
McGillicuddy Serious  420.14-0.20
One NZ  290.10
Mauri Pacific  160.05
The People's Choice  90.03
NMP  40.01
South Island  30.01
Freedom Movement  10.00
Republican  10.00
Informal votes545264
Total valid votes29,12529,406
Labour gain from National Majority4,97817.09

1996 election

1996 general election: Rotorua [35]
Notes:

Blue background denotes the winner of the electorate vote.
Pink background denotes a candidate elected from their party list.
Yellow background denotes an electorate win by a list member, or other incumbent.
A Green check.svgY or Red x.svgN denotes status of any incumbent, win or lose respectively.

PartyCandidateVotes%±%Party votes%±%
National Max Bradford 12,12440.7010,73436.04
Alliance Keith Ridings6,22820.91-10.782,9099.76
NZ First Charles Sturt5,02916.885,41718.18
Labour Rosemary Michie4,14913.936,89523.15
Christian Coalition Geoff Winter8342.801,3164.41
ACT Stephen Wrathall3711.241,4024.70
Conservatives Dennis Quirke2250.75740.24
Progressive Green Allan Williams1920.641020.34
McGillicuddy Serious Adrian Holroyd1830.611020.34
Te Tawharau Hawea Vercoe1830.61110.03
Natural Law Frank Gwynne370.12220.07
Legalise Cannabis  4171.40
United NZ  1740.58
Animals First  520.17
Green Society  240.08
Mana Māori  220.07
Ethnic Minority  120.04
Superannuitants & Youth  120.04
Libertarianz  30.01
Asia Pacific  20.00
Advance NZ  10.00
Informal votes19880
Total valid votes29,78329,783
National holdMajority5,89619.79

1993 election

1993 general election: Rotorua [36]
PartyCandidateVotes%±%
National Paul East 5,893 34.18 -22.69
Alliance Keith Ridings5,46431.69
Labour John Chadwick5,01829.10
Christian Heritage B Kohath3742.16
Independent Reg Turner 1640.95
McGillicuddy Serious Graeme Cairns 1470.85
Defence MovementR Reed1330.77
Natural Law Martin Sharp470.27
Majority4292.48-28.38
Turnout 17,24080.65-0.66
Registered electors 21,376

1990 election

1990 general election: Rotorua [37]
PartyCandidateVotes%±%
National Paul East 9,710 56.87 +1.22
Labour Bruce Raitt4,44026.00
Green Ronald Reed1,73210.14
NewLabour Kevin John Goddard7254.24
Independent Clifford Owen Lee2291.34
Social Credit Margaret Lynley Crosby1700.99
Democrats Trevor Barnard660.38
Majority5,27030.86+17.29
Turnout 17,07281.31-11.99
Registered electors 20,995

1987 election

1987 general election: Rotorua [38]
PartyCandidateVotes%±%
National Paul East 9,883 55.32 +10.17
Labour Rosemary Michie7,45841.74
Democrats H O Dassler5232.92
Majority2,42513.57+9.39
Turnout 17,86493.30-7.75
Registered electors 19,145

1984 election

1984 general election: Rotorua [38]
PartyCandidateVotes%±%
National Paul East 8,746 45.15 -0.20
Labour Brian Arps7,93540.96
NZ Party Ross Alan Aubertin2,09410.81
Social Credit Kevin Douglas Steele5943.06
Majority8114.18-4.90
Turnout 19,369101.05+13.53
Registered electors 19,167

1981 election

1981 general election: Rotorua [38]
PartyCandidateVotes%±%
National Paul East 7,709 45.35 +1.14
Labour Johnny W. Lepper6,16536.26
Social Credit J L Doel3,12418.37
Majority1,5449.08-2.76
Turnout 16,99887.52+17.49
Registered electors 19,421

1978 election

1978 general election: Rotorua [39]
PartyCandidateVotes%±%
National Paul East 7,126 44.21
Labour Peter Tapsell 6,10637.88+1.82
Social Credit Graeme John Eustace2,56515.91
Values Margaret Jane Larsen3211.99
Majority1,0206.32
Turnout 16,11870.03-15.24
Registered electors 23,013

1975 election

1975 general election: Rotorua [39]
PartyCandidateVotes%±%
National Harry Lapwood 11,561 52.40 +3.94
Labour Peter Tapsell 7,95636.06
Social Credit C F Smith1,6177.33
Values Lois McKinnon9254.19
Majority3,60516.34+11.58
Turnout 22,05985.27-3.33
Registered electors 25,868

1972 election

1972 general election: Rotorua [39]
PartyCandidateVotes%±%
National Harry Lapwood 7,997 48.46 -1.44
Labour N F Pachoud7,21143.70
Social Credit R W Johnson9035.47
New Democratic R O Fairweather3302.00-5.89
Liberal Reform C J Tapper590.35
Majority7864.76-2.93
Turnout 16,50088.60+0.59
Registered electors 18,623

1969 election

1969 general election: Rotorua [39]
PartyCandidateVotes%±%
National Harry Lapwood 7,772 49.90 -1.42
Labour Charles Bennett 6,57442.20
Social Credit R O Fairweather1,2297.89
Majority1,1987.69-8.14
Turnout 15,57588.01+5.57
Registered electors 17,695

1966 election

1966 general election: Rotorua [39]
PartyCandidateVotes%±%
National Harry Lapwood 7,450 51.32 -1.20
Labour Frank Knipe5,15235.50
Social Credit Edith Janette Lamason2,46516.98+6.75
Majority2,29815.83+0.56
Turnout 14,51482.44-7.88
Registered electors 17,605

1963 election

1963 general election: Rotorua [39]
PartyCandidateVotes%±%
National Harry Lapwood 7,623 52.52 +5.69
Labour James Phillip Cranston5,40637.25
Social Credit Edith Janette Lamason1,48510.23
Majority2,21715.27+13.13
Turnout 14,51490.32+0.62
Registered electors 16,068

1960 election

1960 general election: Rotorua [39]
PartyCandidateVotes%±%
National Harry Lapwood 7,831 46.83
Labour Ray Boord 7,47344.69-8.59
Social Credit C R Tunnicliffe1,4168.46
Majority3582.14
Turnout 16,72089.70-3.73
Registered electors 18,638

1957 election

1957 general election: Rotorua [39]
PartyCandidateVotes%±%
Labour Ray Boord 8,204 53.28 +4.76
National Murray Linton 6,19540.23
Social Credit Herbert James Buckingham9986.48
Majority2,00913.04+7.51
Turnout 15,39793.43-1.14
Registered electors 16,479

1954 election

1954 general election: Rotorua [39]
PartyCandidateVotes%±%
Labour Ray Boord 7,211 48.52
National Percy Allen 6,38942.99
Social Credit Hubert C. McCready1,2618.48
Majority8225.53
Turnout 14,86194.57
Registered electors 15,714

1943 election

1943 general election: Rotorua [40] [41]
PartyCandidateVotes%±%
National Geoffrey Sim 5,304 49.74
Labour Alexander Moncur 4,58943.03-14.23
Democratic Labour William Henry Tong5214.88
Real Democracy Tom Godfrey Burnham1641.53
Informal votes850.79+0.12
Majority7156.70
Turnout 10,66392.29+0.62
Registered electors 11,553

1938 election

1938 general election: Rotorua [42]
PartyCandidateVotes%±%
Labour Alexander Moncur 6,211 57.26 +14.12
National Henry William Nixon4,56342.06
Informal votes730.67+0.11
Majority1,64815.19+2.39
Turnout 10,84791.67+3.03
Registered electors 11,832

1935 election

1935 general election: Rotorua [43]
PartyCandidateVotes%±%
Labour Alexander Moncur 4,894 43.14 +10.60
Independent Frederick Doidge 3,44230.34
United Cecil Clinkard 2,78524.55-8.60
Democrat H. Hugh Corbin [44] 2231.97
Informal votes640.56-0.08
Majority1,45212.80+12.19
Turnout 11,40888.64+8.81
Registered electors 12,870

1931 election

1931 general election: Rotorua [45]
PartyCandidateVotes%±%
United Cecil Clinkard 3,117 33.15 -10.34
Labour Alexander Moncur 3,06032.54
Independent Edward Earle Vaile 1,81519.30
Country Party D R F Campbell [46] 1,41115.01
Informal votes610.64-0.84
Majority570.61-1.80
Turnout 9,46479.83-4.27
Registered electors 11,855

1928 election

1928 general election: Rotorua [47]
PartyCandidateVotes%±%
United Cecil Clinkard [48] 3,617 43.49 +21.59
Reform Frank Hockly 3,41741.08-18.61
Labour A. G. Christopher [48] 6597.92
Country Party S. H. Judd6247.50
Informal votes1251.48+0.91
Majority2002.40-35.39
Turnout 8,44284.10-5.34
Registered electors 10,038

1925 election

1925 general election: Rotorua [49]
PartyCandidateVotes%±%
Reform Frank Hockly 4,384 59.69 +6.54
Liberal Cecil Clinkard 1,60821.90-24.95
Labour John William Sumner [50] 1,14815.63
Country Party Frank Colbeck [mb 1] 2042.78
Informal votes420.57-0.53
Majority2,77637.80+31.50
Turnout 7,38689.44-1.11
Registered electors 8,258

Table footnotes:

  1. For biographical details of Frank Colbeck, please refer to his father's article

1922 election

1922 general election: Rotorua [17]
PartyCandidateVotes%±%
Reform Frank Hockly 3,407 53.15 +2.70
Liberal Cecil Clinkard [51] 3,00346.85
Informal votes711.10-0.22
Majority4046.30-20.53
Turnout 6,48190.55+8.83
Registered electors 7,157

1919 election

1919 general election: Rotorua [52]
PartyCandidateVotes%±%
Reform Frank Hockly 3,258 50.45
Liberal Malcolm Larney [53] 1,52523.61
Labour George Thomas Jones85413.22
Independent W. C. Hewitt4977.70
Independent Patrick Keegan [54] [nb 1] 3245.02
Majority1,73326.83
Informal votes861.31
Turnout 6,54481.73
Registered electors 8,007

Table footnotes:

  1. Some sources list Keegan as an Independent Reform Party supporter

Notes

  1. Compared to ONE Party
  2. 2017 Internet Party swing is relative to the votes for Internet-Mana in 2014; it shared a party list with Mana Party in the 2014 election
  3. 2017 Mana Party swing is relative to the votes for Internet-Mana in 2014; it shared a party list with the Internet Party in the 2014 election

Related Research Articles

<span class="mw-page-title-main">1978 New Zealand general election</span> General election in New Zealand

The 1978 New Zealand general election was a nationwide vote to elect the 39th New Zealand Parliament. It saw the governing National Party, led by Robert Muldoon, retain office, but the opposition Labour Party won the largest share of the vote. Reorganisation of the enrolment system caused major problems with the electoral rolls, which left a legacy of unreliable information about voting levels in this election.

<span class="mw-page-title-main">1911 New Zealand general election</span>

The 1911 New Zealand general election was held on Thursday, 7 and 14 December in the general electorates, and on Tuesday, 19 December in the Māori electorates to elect a total of 80 MPs to the 18th session of the New Zealand Parliament. A total number of 590,042 (83.5%) voters turned out to vote. In two seats there was only one candidate.

<span class="mw-page-title-main">1919 New Zealand general election</span> Election in New Zealand

The 1919 New Zealand general election was held on Tuesday, 16 December in the Māori electorates and on Wednesday, 17 December in the general electorates to elect a total of 80 MPs to the 20th session of the New Zealand Parliament. A total number of 560,673 (80.5%) voters turned out to vote.

Albany was a New Zealand electorate. It was located in north Auckland, and named after the suburb of Albany. It existed from 1978 to 1984, and then was reinstated in 1987 before its final abolition in 2002.

<span class="mw-page-title-main">Bay of Plenty (New Zealand electorate)</span> Electoral district in New Zealand

Bay of Plenty is a New Zealand electoral division returning one member to the New Zealand House of Representatives. The current representative is Tom Rutherford of the National Party, first elected at the 2023 election.

<span class="mw-page-title-main">Coromandel (New Zealand electorate)</span> Electoral district in Waikato, New Zealand

Coromandel is a New Zealand electoral division returning one member to the House of Representatives. It is currently represented by Scott Simpson, a member of the National Party.

<span class="mw-page-title-main">Hamilton West (New Zealand electorate)</span> Electoral district in Waikato, New Zealand

Hamilton West is a New Zealand parliamentary electorate. It has been held by Tama Potaka MP of the National Party since the 2022 by-election.

<span class="mw-page-title-main">Māngere (New Zealand electorate)</span> Electoral district in Auckland, New Zealand

Māngere is a New Zealand parliamentary electorate, returning one member of parliament to the Representatives of New Zealand. The current MP for Māngere is Lemauga Lydia Sosene of the Labour Party. She has held this electorate since 2023.

<span class="mw-page-title-main">Tauranga (New Zealand electorate)</span> Electoral district in Bay of Plenty, New Zealand

Tauranga is a New Zealand parliamentary electorate, returning one Member of Parliament to the New Zealand House of Representatives. The current MP for Tauranga is Sam Uffindell of the National Party, who won the seat in the 2022 Tauranga by-election, following the resignation of the previous MP, Simon Bridges of the National Party.

<span class="mw-page-title-main">Wairarapa (New Zealand electorate)</span> Electoral district in New Zealand

Wairarapa is a New Zealand parliamentary electorate. It was first created in 1858 and existed until 1881. It was recreated in 1887 and has since existed continuously. The current Wairarapa electorate MP is Mike Butterick.

<span class="mw-page-title-main">Whangārei (New Zealand electorate)</span> Electoral district in Northland, New Zealand

Whangārei is a New Zealand parliamentary electorate that was first created for the 1972 election. The electorate is usually a reasonably safe National seat, and was held for long periods by John Banks (1981–1999) and Phil Heatley (1999–2014), before being won in the 2014 election by Shane Reti. In the 2020 election Reti narrowly lost the seat to Labour's Emily Henderson. Reti would reclaim the seat at the 2023 election with a huge majority.

<span class="mw-page-title-main">Papakura (New Zealand electorate)</span> Electoral district in Auckland, New Zealand

Papakura is an electorate for the New Zealand House of Representatives, based in the south Auckland town of Papakura. Historically, the name refers to an electorate that existed between 1978 and 1996, which with the advent of Mixed Member Proportional voting and resulting reduction in the number of constituencies was folded into a new Hunua seat. In 2002 Hunua was modified, pulled northwards and renamed Clevedon.

<span class="mw-page-title-main">Hunua (New Zealand electorate)</span> Former electorate in Auckland, New Zealand

The Hunua electorate existed three times for the New Zealand House of Representatives beginning in 1978, based at the south end of the Auckland urban area, and named for the Hunua Ranges. It covered different geographical areas over those periods. The electorate was last represented by Andrew Bayly of the National Party before its dissolution in 2020.

Kaimai is a former New Zealand parliamentary electorate, from 1978 to 1996. In 1996 the MP Robert Anderson was selected for the new seat of Coromandel, but retired due to illness, and was replaced by Murray McLean, who won the new seat.

Waimarino was a New Zealand parliamentary electorate that existed from 1911 to 1954, and from 1963 to 1972. It was rural in nature and was represented by four Members of Parliament.

<span class="mw-page-title-main">Paddy Kearins</span> New Zealand politician

Patrick Kearins was a Member of Parliament for Waimarino, in the North Island of New Zealand.

Tongariro is a former New Zealand parliamentary electorate, from 1984 to 1996. During the four parliamentary terms of its existence, it was represented by three members of parliament.

East Cape is a former New Zealand Parliamentary electorate, from 1978 to 1993.

Ohinemuri is a former New Zealand parliamentary electorate. It existed from 1896 to 1928, and was represented by five Members of Parliament.

Taumarunui was a parliamentary electorate in the King Country in the Manawatū-Whanganui region of New Zealand from 1908 to 1919. The electorate was represented by two Members of Parliament.

References

  1. Profile of Todd McClay on New Zealand Parliament website.
  2. McRobie 1989, pp. 75–80.
  3. McRobie 1989, pp. 78f.
  4. McRobie 1989, pp. 82f.
  5. McRobie 1989, pp. 86f.
  6. McRobie 1989, pp. 90f.
  7. McRobie 1989, pp. 94f.
  8. McRobie 1989, pp. 99f.
  9. McRobie 1989, pp. 95–100.
  10. McRobie 1989, p. 99.
  11. McRobie 1989, pp. 90, 98.
  12. “Average” Māori – who is she? Te Puni Kōkiri: Kōkiri 1, 2007
  13. McRobie 1989, pp. 79–95.
  14. McRobie 1989, pp. 38–75.
  15. "The General Election". Auckland Star . Vol. LIII, no. 53. 4 March 1922. p. 6. Retrieved 17 December 2014.
  16. "The Election Campaign". The Press . Vol. LVIII, no. 17607. 9 November 1922. p. 14. Retrieved 17 December 2014.
  17. 1 2 Hislop, J. (1923). The General Election, 1922. Government Printer. p. 2. Retrieved 6 December 2014.
  18. Wilson 1985, p. 234.
  19. Wilson 1985, p. 184.
  20. Wilson 1985, pp. 184, 211.
  21. Wilson 1985, p. 211.
  22. "Part III – Party Lists of Successful Registered Parties" (PDF). Electoral Commission. Retrieved 14 June 2013.
  23. "Electorate Candidate and Party Votes Recorded at Each Polling Place – Rotorua, 1996" (PDF). Retrieved 16 November 2013.
  24. "Official Count Results - Rotorua". Wellington: New Zealand Electoral Commission. Retrieved 14 November 2023.
  25. "Official Count Results - Rotorua". Wellington: New Zealand Electoral Commission. Retrieved 14 November 2020.
  26. "Official Count Results – Rotorua". Wellington: New Zealand Electoral Commission. Retrieved 22 December 2017.
  27. Official Count Results – Rotorua, 2014
  28. Official Count Results – Rotorua, 2011
  29. "Enrolment statistics". Electoral Commission. 26 November 2011. Retrieved 27 November 2011.
  30. Official Count Results – Rotorua, 2008
  31. Official Count Results – Rotorua, 2005
  32. Official Count Results - Rotorua, 2002
  33. Official Count Results - Electorate - Rotorua, 1999
  34. Official Count Results - Party Vote - Rotorua, 1999
  35. "Rotorua 46" (PDF). Electoral Commission. Retrieved 26 March 2022.
  36. Part 1: Votes recorded at each polling place (Technical report). New Zealand Chief Electoral Office. 1993. p. 97.
  37. Part 1: Votes recorded at each polling place (Technical report). New Zealand Chief Electoral Office. 1990. p. 101.
  38. 1 2 3 Norton 1988, p. 340.
  39. 1 2 3 4 5 6 7 8 9 Norton 1988, p. 339.
  40. "The General Election, 1943". National Library. 1944. p. 11. Retrieved 28 March 2014.
  41. "Electoral". The New Zealand Herald . Vol. 80, no. 24714. 14 October 1943. p. 6. Retrieved 16 May 2017.
  42. "The General Election, 1938". National Library. 1939. pp. 1–6. Retrieved 8 February 2012.
  43. "General Election". The Evening Post . Vol. CXX, no. 138. 7 December 1935. p. 11. Retrieved 16 November 2013.
  44. Tunnicliff, Shirley. "Lorelle Henderson Corbin". Dictionary of New Zealand Biography . Ministry for Culture and Heritage . Retrieved 1 December 2011.
  45. The General Election, 1931. Government Printer. 1932. p. 4. Retrieved 2 November 2014.
  46. "General Election". Auckland Star . Vol. LXII, no. 264. 7 November 1931. p. 11. Retrieved 2 December 2014.
  47. The General Election, 1928. Government Printer. 1929. p. 5. Retrieved 29 November 2014.
  48. 1 2 "The Rotorua Seat". The New Zealand Herald . Vol. LXV, no. 20102. 13 November 1928. p. 16. Retrieved 12 December 2014.
  49. The General Election, 1925. Government Printer. 1926. p. 2. Retrieved 20 November 2014.
  50. "New Zealand Alliance". Auckland Star . Vol. LVI, no. 259. 2 November 1925. p. 16. Retrieved 12 December 2014.
  51. "Liberals Foregather". Auckland Star . Vol. LIII, no. 300. 19 December 1922. p. 7. Retrieved 12 December 2014.
  52. Hislop, J. (1921). The General Election, 1919. National Library. p. 2. Retrieved 12 December 2014.
  53. "Rotorua Seat". Auckland Star . Vol. L, no. 282. 27 November 1919. p. 11. Retrieved 12 December 2014.
  54. "Interprovincial". Poverty Bay Herald . Vol. XLVI, no. 15041. 16 October 1919. p. 3. Retrieved 12 December 2014.