Surface weather analysis is a special type of weather map that provides a view of weather elements over a geographical area at a specified time based on information from ground-based weather stations.

Weather forecasting is the application of science and technology to predict the conditions of the atmosphere for a given location and time. People have attempted to predict the weather informally for millennia and formally since the 19th century.

A weather station is a facility, either on land or sea, with instruments and equipment for measuring atmospheric conditions to provide information for weather forecasts and to study the weather and climate. The measurements taken include temperature, atmospheric pressure, humidity, wind speed, wind direction, and precipitation amounts. Wind measurements are taken with as few other obstructions as possible, while temperature and humidity measurements are kept free from direct solar radiation, or insolation. Manual observations are taken at least once daily, while automated measurements are taken at least once an hour. Weather conditions out at sea are taken by ships and buoys, which measure slightly different meteorological quantities such as sea surface temperature (SST), wave height, and wave period. Drifting weather buoys outnumber their moored versions by a significant amount.

The National Weather Service (NWS) is an agency of the United States federal government that is tasked with providing weather forecasts, warnings of hazardous weather, and other weather-related products to organizations and the public for the purposes of protection, safety, and general information. It is a part of the National Oceanic and Atmospheric Administration (NOAA) branch of the Department of Commerce, and is headquartered in Silver Spring, Maryland, within the Washington metropolitan area. The agency was known as the United States Weather Bureau from 1890 until it adopted its current name in 1970.
A weather map, also known as synoptic weather chart, displays various meteorological features across a particular area at a particular point in time and has various symbols which all have specific meanings. Such maps have been in use since the mid-19th century and are used for research and weather forecasting purposes. Maps using isotherms show temperature gradients, which can help locate weather fronts. Isotach maps, analyzing lines of equal wind speed, on a constant pressure surface of 300 or 250 hPa show where the jet stream is located. Use of constant pressure charts at the 700 and 500 hPa level can indicate tropical cyclone motion. Two-dimensional streamlines based on wind speeds at various levels show areas of convergence and divergence in the wind field, which are helpful in determining the location of features within the wind pattern. A popular type of surface weather map is the surface weather analysis, which plots isobars to depict areas of high pressure and low pressure. Cloud codes are translated into symbols and plotted on these maps along with other meteorological data that are included in synoptic reports sent by professionally trained observers.

METAR is a format for reporting weather information. A METAR weather report is predominantly used by aircraft pilots, and by meteorologists, who use aggregated METAR information to assist in weather forecasting. Today, according to the advancement of technology in civil aviation, the METAR is sent as IWXXM model.
In meteorology and aviation, terminal aerodrome forecast (TAF) is a format for reporting weather forecast information, particularly as it relates to aviation. TAFs are issued at least four times a day, every six hours, for major civil airfields: 0000, 0600, 1200 and 1800 UTC, and generally apply to a 24- or 30-hour period, and an area within approximately five statute miles (8.0 km) from the center of an airport runway complex. TAFs are issued every three hours for military airfields and some civil airfields and cover a period ranging from 3 hours to 30 hours.
A pilot report or PIREP is a report of actual flight or ground conditions encountered by an aircraft. Reports commonly include information about atmospheric conditions or airport conditions. This information is usually relayed by radio to the nearest ground station, but other options also exist in some regions. The message would then be encoded and relayed to other weather offices and air traffic service units.
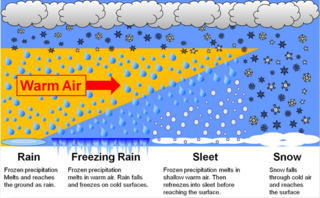
In meteorology, the different types of precipitation often include the character, formation, or phase of the precipitation which is falling to ground level. There are three distinct ways that precipitation can occur. Convective precipitation is generally more intense, and of shorter duration, than stratiform precipitation. Orographic precipitation occurs when moist air is forced upwards over rising terrain and condenses on the slope, such as a mountain.

In meteorology, station models are symbolic illustrations showing the weather occurring at a given reporting station. Meteorologists created the station model to fit a number of weather elements into a small space on weather maps. This allows map users to analyze patterns in atmospheric pressure, temperature, wind speed and direction, cloud cover, precipitation, and other parameters. The most common station plots depict surface weather observations although upper air plots at various mandatory levels are also frequently depicted.

Meteorological instruments, including meteorological sensors, are the equipment used to find the state of the atmosphere at a given time. Each science has its own unique sets of laboratory equipment. Meteorology, however, is a science which does not use much laboratory equipment but relies more on on-site observation and remote sensing equipment. In science, an observation, or observable, is an abstract idea that can be measured and for which data can be taken. Rain was one of the first quantities to be measured historically. Two other accurately measured weather-related variables are wind and humidity. Many attempts had been made prior to the 15th century to construct adequate equipment to measure atmospheric variables.

Airport weather stations are automated sensor suites which are designed to serve aviation and meteorological operations, weather forecasting and climatology. Automated airport weather stations have become part of the backbone of weather observing in the United States and Canada and are becoming increasingly more prevalent worldwide due to their efficiency and cost-savings.

The following outline is provided as an overview of and topical guide to the field of Meteorology.
Surface weather observations are the fundamental data used for safety as well as climatological reasons to forecast weather and issue warnings worldwide. They can be taken manually, by a weather observer, by computer through the use of automated weather stations, or in a hybrid scheme using weather observers to augment the otherwise automated weather station. The ICAO defines the International Standard Atmosphere (ISA), which is the model of the standard variation of pressure, temperature, density, and viscosity with altitude in the Earth's atmosphere, and is used to reduce a station pressure to sea level pressure. Airport observations can be transmitted worldwide through the use of the METAR observing code. Personal weather stations taking automated observations can transmit their data to the United States mesonet through the Citizen Weather Observer Program (CWOP), the UK Met Office through their Weather Observations Website (WOW), or internationally through the Weather Underground Internet site. A thirty-year average of a location's weather observations is traditionally used to determine the station's climate. In the US a network of Cooperative Observers make a daily record of summary weather and sometimes water level information.
Winds aloft, officially known as the winds and temperatures aloft forecast,, is a forecast of specific atmospheric conditions in terms of wind and temperature at certain altitudes, typically measured in feet (ft) above mean sea level (MSL). The forecast is specifically used for aviation purposes.
CLIMAT is a code for reporting monthly climatological data assembled at land-based meteorological surface observation sites to data centres. CLIMAT-coded messages contain information on several meteorological variables that are important to monitor characteristics, changes, and variability of climate. Usually these messages are sent and exchanged via the Global Telecommunication System (GTS) of the World Meteorological Organisation (WMO). Modifications of the CLIMAT code are the CLIMAT SHIP and CLIMAT TEMP / CLIMAT TEMP SHIP codes which serve to report monthly climatological data assembled at ocean-based meteorological surface observation sites and at land-/ocean-based meteorological upper-air observation sites, respectively. The monthly values included usually are obtained by averaging observational values of one or several daily observations over the respective month.
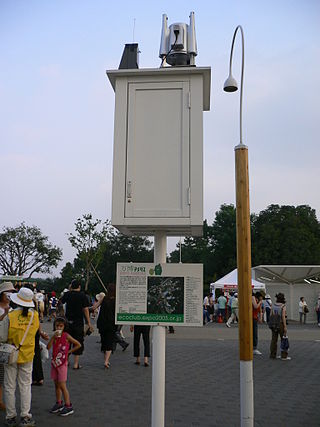
Automated Meteorological Data Acquisition System (AMeDAS), commonly known in Japanese as "アメダス" (amedasu), is a high-resolution surface observation network developed by the Japan Meteorological Agency (JMA) used for gathering regional weather data and verifying forecast performance. The system began operating on 1 November 1974, and currently comprises 1,300 stations throughout Japan, with an average separation of 17 km (11 mi).

This glossary of meteorology is a list of terms and concepts relevant to meteorology and atmospheric science, their sub-disciplines, and related fields.

A meteorological observer, or weather observer, is a person authorized by a weather authority to make or record meteorological observations. They are technicians who are responsible for the accurate observation, rapid measurement, timely collection, recording, and timely submission of meteorological parameters and information and various atmospheric phenomena to the Meteorological Center. Surface, upper air, radar, and satellite are all forms of weather observations.