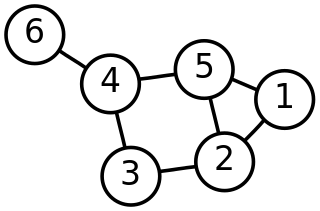
In mathematics, graph theory is the study of graphs, which are mathematical structures used to model pairwise relations between objects. A graph in this context is made up of vertices which are connected by edges. A distinction is made between undirected graphs, where edges link two vertices symmetrically, and directed graphs, where edges link two vertices asymmetrically. Graphs are one of the principal objects of study in discrete mathematics.

Social network analysis (SNA) is the process of investigating social structures through the use of networks and graph theory. It characterizes networked structures in terms of nodes and the ties, edges, or links that connect them. Examples of social structures commonly visualized through social network analysis include social media networks, memes spread, information circulation, friendship and acquaintance networks, business networks, knowledge networks, difficult working relationships, social networks, collaboration graphs, kinship, disease transmission, and sexual relationships. These networks are often visualized through sociograms in which nodes are represented as points and ties are represented as lines. These visualizations provide a means of qualitatively assessing networks by varying the visual representation of their nodes and edges to reflect attributes of interest.
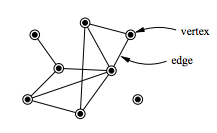
This is a glossary of graph theory. Graph theory is the study of graphs, systems of nodes or vertices connected in pairs by lines or edges.

In the mathematical theory of directed graphs, a graph is said to be strongly connected if every vertex is reachable from every other vertex. The strongly connected components of an arbitrary directed graph form a partition into subgraphs that are themselves strongly connected. It is possible to test the strong connectivity of a graph, or to find its strongly connected components, in linear time.
Network theory is the study of graphs as a representation of either symmetric relations or asymmetric relations between discrete objects. In computer science and network science, network theory is a part of graph theory: a network can be defined as a graph in which nodes and/or edges have attributes.
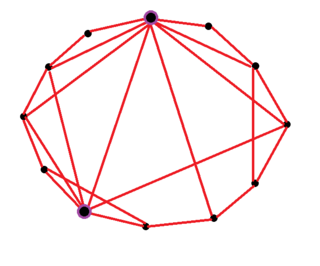
A small-world network is a type of mathematical graph in which most nodes are not neighbors of one another, but the neighbors of any given node are likely to be neighbors of each other and most nodes can be reached from every other node by a small number of hops or steps. Specifically, a small-world network is defined to be a network where the typical distance L between two randomly chosen nodes grows proportionally to the logarithm of the number of nodes N in the network, that is:
In graph theory, a clustering coefficient is a measure of the degree to which nodes in a graph tend to cluster together. Evidence suggests that in most real-world networks, and in particular social networks, nodes tend to create tightly knit groups characterised by a relatively high density of ties; this likelihood tends to be greater than the average probability of a tie randomly established between two nodes.
In graph theory and network analysis, indicators of centrality assign numbers or rankings to nodes within a graph corresponding to their network position. Applications include identifying the most influential person(s) in a social network, key infrastructure nodes in the Internet or urban networks, super-spreaders of disease, and brain networks. Centrality concepts were first developed in social network analysis, and many of the terms used to measure centrality reflect their sociological origin.

In mathematics and computer science, connectivity is one of the basic concepts of graph theory: it asks for the minimum number of elements that need to be removed to separate the remaining nodes into two or more isolated subgraphs. It is closely related to the theory of network flow problems. The connectivity of a graph is an important measure of its resilience as a network.
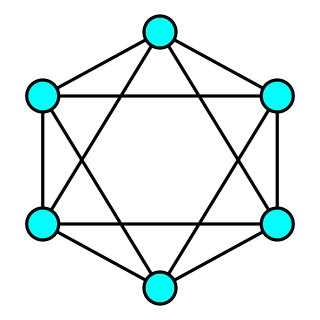
In graph theory, a connected graph G is said to be k-vertex-connected if it has more than k vertices and remains connected whenever fewer than k vertices are removed.

In the mathematical field of graph theory, the Erdős–Rényi model is either of two closely related models for generating random graphs or the evolution of a random network. They are named after Hungarian mathematicians Paul Erdős and Alfréd Rényi, who first introduced one of the models in 1959, while Edgar Gilbert introduced the other model contemporaneously and independently of Erdős and Rényi. In the model of Erdős and Rényi, all graphs on a fixed vertex set with a fixed number of edges are equally likely; in the model introduced by Gilbert, also called the Erdős–Rényi–Gilbert model, each edge has a fixed probability of being present or absent, independently of the other edges. These models can be used in the probabilistic method to prove the existence of graphs satisfying various properties, or to provide a rigorous definition of what it means for a property to hold for almost all graphs.

In graph theory, a starSk is the complete bipartite graph K1,k : a tree with one internal node and k leaves. Alternatively, some authors define Sk to be the tree of order k with maximum diameter 2; in which case a star of k > 2 has k − 1 leaves.
The clique percolation method is a popular approach for analyzing the overlapping community structure of networks. The term network community has no widely accepted unique definition and it is usually defined as a group of nodes that are more densely connected to each other than to other nodes in the network. There are numerous alternative methods for detecting communities in networks, for example, the Girvan–Newman algorithm, hierarchical clustering and modularity maximization.
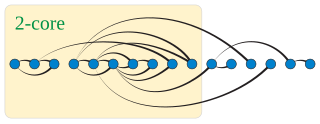
In graph theory, a k-degenerate graph is an undirected graph in which every subgraph has a vertex of degree at most k: that is, some vertex in the subgraph touches k or fewer of the subgraph's edges. The degeneracy of a graph is the smallest value of k for which it is k-degenerate. The degeneracy of a graph is a measure of how sparse it is, and is within a constant factor of other sparsity measures such as the arboricity of a graph.
A social network is a social structure made up of a set of social actors, sets of dyadic ties, and other social interactions between actors. The social network perspective provides a set of methods for analyzing the structure of whole social entities as well as a variety of theories explaining the patterns observed in these structures. The study of these structures uses social network analysis to identify local and global patterns, locate influential entities, and examine network dynamics.
The HCS clustering algorithm is an algorithm based on graph connectivity for cluster analysis. It works by representing the similarity data in a similarity graph, and then finding all the highly connected subgraphs. It does not make any prior assumptions on the number of the clusters. This algorithm was published by Erez Hartuv and Ron Shamir in 2000.
The rich-club coefficient is a metric on graphs and networks, designed to measure the extent to which well-connected nodes also connect to each other. Networks which have a relatively high rich-club coefficient are said to demonstrate the rich-club effect and will have many connections between nodes of high degree. The rich-club coefficient was first introduced in 2004 in a paper studying Internet topology.
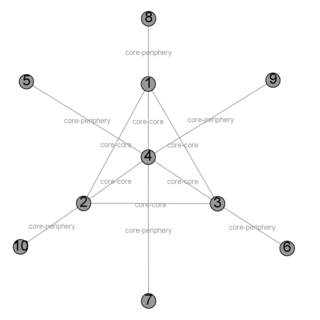
Core periphery structure is a network theory model.
Discovering communities in a network, known as community detection/discovery, is a fundamental problem in network science, which attracted much attention in the past several decades. In recent years, with the tremendous studies on big data, another related but different problem, called community search, which aims to find the most likely community that contains the query node, has attracted great attention from both academic and industry areas. It is a query-dependent variant of the community detection problem. A detailed survey of community search can be found at ref., which reviews all the recent studies
Blockmodeling is a set or a coherent framework, that is used for analyzing social structure and also for setting procedure(s) for partitioning (clustering) social network's units, based on specific patterns, which form a distinctive structure through interconnectivity. It is primarily used in statistics, machine learning and network science.


