Related Research Articles

In mathematics, the Lyapunov exponent or Lyapunov characteristic exponent of a dynamical system is a quantity that characterizes the rate of separation of infinitesimally close trajectories. Quantitatively, two trajectories in phase space with initial separation vector diverge at a rate given by

In mathematics, a time series is a series of data points indexed in time order. Most commonly, a time series is a sequence taken at successive equally spaced points in time. Thus it is a sequence of discrete-time data. Examples of time series are heights of ocean tides, counts of sunspots, and the daily closing value of the Dow Jones Industrial Average.

J. Doyne Farmer is an American complex systems scientist and entrepreneur with interests in chaos theory, complexity and econophysics. He is Baillie Gifford Professor of Complex Systems Science at the Smith School of Enterprise and the Environment, Oxford University, where he is also director of the Complexity Economics programme at the Institute for New Economic Thinking at the Oxford Martin School. Additionally he is an external professor at the Santa Fe Institute. His current research is on complexity economics, focusing on systemic risk in financial markets and technological progress. During his career he has made important contributions to complex systems, chaos, artificial life, theoretical biology, time series forecasting and econophysics. He co-founded Prediction Company, one of the first companies to do fully automated quantitative trading. While a graduate student he led a group that called itself Eudaemonic Enterprises and built the first wearable digital computer, which was used to beat the game of roulette. He is a founder and the Chief Scientist of Macrocosm Inc, a company devoted to scaling up complexity economics methods and reducing them to practice.
In time series analysis, the Box–Jenkins method, named after the statisticians George Box and Gwilym Jenkins, applies autoregressive moving average (ARMA) or autoregressive integrated moving average (ARIMA) models to find the best fit of a time-series model to past values of a time series.
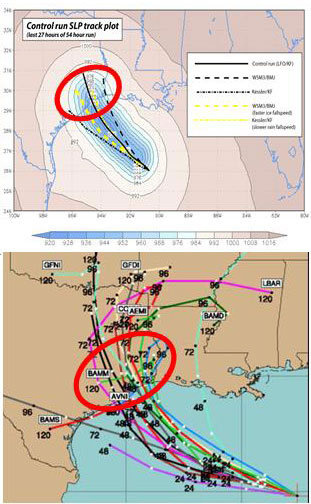
Ensemble forecasting is a method used in or within numerical weather prediction. Instead of making a single forecast of the most likely weather, a set of forecasts is produced. This set of forecasts aims to give an indication of the range of possible future states of the atmosphere. Ensemble forecasting is a form of Monte Carlo analysis. The multiple simulations are conducted to account for the two usual sources of uncertainty in forecast models: (1) the errors introduced by the use of imperfect initial conditions, amplified by the chaotic nature of the evolution equations of the atmosphere, which is often referred to as sensitive dependence on initial conditions; and (2) errors introduced because of imperfections in the model formulation, such as the approximate mathematical methods to solve the equations. Ideally, the verified future atmospheric state should fall within the predicted ensemble spread, and the amount of spread should be related to the uncertainty (error) of the forecast. In general, this approach can be used to make probabilistic forecasts of any dynamical system, and not just for weather prediction.
Model selection is the task of selecting a model from among various candidates on the basis of performance criterion to choose the best one. In the context of machine learning and more generally statistical analysis, this may be the selection of a statistical model from a set of candidate models, given data. In the simplest cases, a pre-existing set of data is considered. However, the task can also involve the design of experiments such that the data collected is well-suited to the problem of model selection. Given candidate models of similar predictive or explanatory power, the simplest model is most likely to be the best choice.

A multifractal system is a generalization of a fractal system in which a single exponent is not enough to describe its dynamics; instead, a continuous spectrum of exponents is needed.
In data analysis, anomaly detection is generally understood to be the identification of rare items, events or observations which deviate significantly from the majority of the data and do not conform to a well defined notion of normal behavior. Such examples may arouse suspicions of being generated by a different mechanism, or appear inconsistent with the remainder of that set of data.

An echo state network (ESN) is a type of reservoir computer that uses a recurrent neural network with a sparsely connected hidden layer. The connectivity and weights of hidden neurons are fixed and randomly assigned. The weights of output neurons can be learned so that the network can produce or reproduce specific temporal patterns. The main interest of this network is that although its behavior is non-linear, the only weights that are modified during training are for the synapses that connect the hidden neurons to output neurons. Thus, the error function is quadratic with respect to the parameter vector and can be differentiated easily to a linear system.
Reservoir computing is a framework for computation derived from recurrent neural network theory that maps input signals into higher dimensional computational spaces through the dynamics of a fixed, non-linear system called a reservoir. After the input signal is fed into the reservoir, which is treated as a "black box," a simple readout mechanism is trained to read the state of the reservoir and map it to the desired output. The first key benefit of this framework is that training is performed only at the readout stage, as the reservoir dynamics are fixed. The second is that the computational power of naturally available systems, both classical and quantum mechanical, can be used to reduce the effective computational cost.
HD 11506 is a star in the equatorial constellation of Cetus. It has a yellow hue and can be viewed with a small telescope but is too faint to be visible to the naked eye, having an apparent visual magnitude of 7.51. The distance to this object is 167 light years based on parallax, but it is drifting closer to the Sun with a radial velocity of −7.5 km/s. It has an absolute magnitude of 3.94.

Didier Sornette is a French researcher studying subjects including complex systems and risk management. He is Professor on the Chair of Entrepreneurial Risks at the Swiss Federal Institute of Technology Zurich and is also a professor of the Swiss Finance Institute, He was previously a Professor of Geophysics at UCLA, Los Angeles California (1996–2006) and a Research Professor at the French National Centre for Scientific Research (1981–2006).
Synthetic data is information that is artificially generated rather than produced by real-world events. Typically created using algorithms, synthetic data can be deployed to validate mathematical models and to train machine learning models.

Deep learning is the subset of machine learning methods based on neural networks with representation learning. The adjective "deep" refers to the use of multiple layers in the network. Methods used can be either supervised, semi-supervised or unsupervised.
Surrogate data testing is a statistical proof by contradiction technique similar to permutation tests and parametric bootstrapping. It is used to detect non-linearity in a time series. The technique involves specifying a null hypothesis describing a linear process and then generating several surrogate data sets according to using Monte Carlo methods. A discriminating statistic is then calculated for the original time series and all the surrogate set. If the value of the statistic is significantly different for the original series than for the surrogate set, the null hypothesis is rejected and non-linearity assumed.
Brain connectivity estimators represent patterns of links in the brain. Connectivity can be considered at different levels of the brain's organisation: from neurons, to neural assemblies and brain structures. Brain connectivity involves different concepts such as: neuroanatomical or structural connectivity, functional connectivity and effective connectivity.

Quantum machine learning is the integration of quantum algorithms within machine learning programs.
GJ 3512 is a nearby star in the northern circumpolar constellation of Ursa Major. It is invisible to the naked eye but can be observed using a telescope, having an apparent visual magnitude of +15.05. The star is located at a distance of 31 light-years from the Sun based on parallax. It has a high proper motion, traversing the celestial sphere at the rate of 1.311″ yr−1. The measurement of the star's radial velocity is poorly constrained, but it appears to be drifting further away at a rate of ~8 km/s.
Electricity price forecasting (EPF) is a branch of energy forecasting which focuses on using mathematical, statistical and machine learning models to predict electricity prices in the future. Over the last 30 years electricity price forecasts have become a fundamental input to energy companies’ decision-making mechanisms at the corporate level.
Boson sampling is a restricted model of non-universal quantum computation introduced by Scott Aaronson and Alex Arkhipov after the original work of Lidror Troyansky and Naftali Tishby, that explored possible usage of boson scattering to evaluate expectation values of permanents of matrices. The model consists of sampling from the probability distribution of identical bosons scattered by a linear interferometer. Although the problem is well defined for any bosonic particles, its photonic version is currently considered as the most promising platform for a scalable implementation of a boson sampling device, which makes it a non-universal approach to linear optical quantum computing. Moreover, while not universal, the boson sampling scheme is strongly believed to implement computing tasks which are hard to implement with classical computers by using far fewer physical resources than a full linear-optical quantum computing setup. This advantage makes it an ideal candidate for demonstrating the power of quantum computation in the near term.
References
- 1 2 3 4 Kaefer, Paul E. (2015). Transforming Analogous Time Series Data to Improve Natural Gas Demand Forecast Accuracy (M.Sc. thesis). Marquette University. Archived from the original on 2016-03-12. Retrieved 2016-02-18.
- 1 2 Prichard; Theiler (1994). "Generating surrogate data for time series with several simultaneously measured variables" (PDF). Physical Review Letters. 73 (7): 951–954. arXiv: comp-gas/9405002 . Bibcode:1994PhRvL..73..951P. doi:10.1103/physrevlett.73.951. PMID 10057582. S2CID 32748996.
- ↑ "Surrogate Data Meaning". Columbia Analytical Services, Inc., now ALS Environmental. Archived from the original on February 16, 2017. Retrieved February 15, 2017.
What is Surrogate Data? Data from studies of test organisms or a test substance that are used to estimate the characteristics or effects on another organism or substance.
- 1 2 Hernández-Camacho, Claudia J.; Bakker, Victoria. J.; Aurioles-Gamboa, David; Laake, Jeff; Gerber, Leah R. (September 2015). Aaron W. Reed (ed.). "The Use of Surrogate Data in Demographic Population Viability Analysis: A Case Study of California Sea Lions". PLOS ONE . 10 (9): e0139158. Bibcode:2015PLoSO..1039158H. doi: 10.1371/journal.pone.0139158 . PMC 4587556 . PMID 26413746.
- 1 2 Faith, D.P.; Walker, P.A. (1996). "Environmental diversity: on the best-possible use of surrogate data for assessing the relative biodiversity of sets of areas". Biodiversity and Conservation. 5 (4). Springer Nature: 399–415. doi:10.1007/BF00056387. S2CID 24066193.
- ↑ Duncan, George T.; Gorr, Wilpen L.; Szczypula, Janusz (2001). "Forecasting Analogous Time Series". In J. Scott Armstrong (ed.). Principles of Forecasting: A Handbook for Researchers and Practitioners. Kluwer Academic Publishers. pp. 195–213. ISBN 0-7923-7930-6.
- ↑ Kaefer, Paul E.; Ishola, Babatunde; Brown, Ronald H.; Corliss, George F. (2015). Using Surrogate Data to Mitigate the Risks of Natural Gas Forecasting on Unusual Days (PDF). International Institute of Forecasters: 35th International Symposium on Forecasting. forecasters.org/isf. Archived (PDF) from the original on 2021-05-17. Retrieved 2022-07-20.
- 1 2 Schreiber, Thomas; Schmitz, Andreas (1999). "Surrogate time series". Physica D. 142 (3–4): 346–382. arXiv: chao-dyn/9909037 . Bibcode:2000PhyD..142..346S. CiteSeerX 10.1.1.46.3999 . doi:10.1016/s0167-2789(00)00043-9. S2CID 13889229.