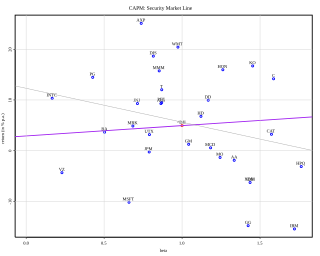
In finance, the capital asset pricing model (CAPM) is a model used to determine a theoretically appropriate required rate of return of an asset, to make decisions about adding assets to a well-diversified portfolio.

In probability theory and statistics, the beta distribution is a family of continuous probability distributions defined on the interval [0, 1] in terms of two positive parameters, denoted by alpha (α) and beta (β), that appear as exponents of the variable and its complement to 1, respectively, and control the shape of the distribution.
Modern portfolio theory (MPT), or mean-variance analysis, is a mathematical framework for assembling a portfolio of assets such that the expected return is maximized for a given level of risk. It is a formalization and extension of diversification in investing, the idea that owning different kinds of financial assets is less risky than owning only one type. Its key insight is that an asset's risk and return should not be assessed by itself, but by how it contributes to a portfolio's overall risk and return. It uses the variance of asset prices as a proxy for risk.
In finance, arbitrage pricing theory (APT) is a multi-factor model for asset pricing which relates various macro-economic (systematic) risk variables to the pricing of financial assets. Proposed by economist Stephen Ross in 1976, it is widely believed to be an improved alternative to its predecessor, the Capital Asset Pricing Model (CAPM). APT is founded upon the law of one price, which suggests that within an equilibrium market, rational investors will implement arbitrage such that the equilibrium price is eventually realised. As such, APT argues that when opportunities for arbitrage are exhausted in a given period, then the expected return of an asset is a linear function of various factors or theoretical market indices, where sensitivities of each factor is represented by a factor-specific beta coefficient or factor loading. Consequently, it provides traders with an indication of ‘true’ asset value and enables exploitation of market discrepancies via arbitrage. The linear factor model structure of the APT is used as the basis for evaluating asset allocation, the performance of managed funds as well as the calculation of cost of capital. Furthermore, the newer APT model is more dynamic being utilised in more theoretical application than the preceding CAPM model. A 1986 article written by Gregory Connor and Robert Korajczyk, utilised the APT framework and applied it to portfolio performance measurement suggesting that the Jensen coefficient is an acceptable measurement of portfolio performance.
In finance, the beta is a measure of how an individual asset moves when the overall stock market increases or decreases. Thus, beta is a useful measure of the contribution of an individual asset to the risk of the market portfolio when it is added in small quantity. Thus, beta is referred to as an asset's non-diversifiable risk, its systematic risk, market risk, or hedge ratio. Beta is not a measure of idiosyncratic risk.
In finance, Jensen's alpha is used to determine the abnormal return of a security or portfolio of securities over the theoretical expected return. It is a version of the standard alpha based on a theoretical performance instead of a market index.
The Treynor reward to volatility model, named after Jack L. Treynor, is a measurement of the returns earned in excess of that which could have been earned on an investment that has no diversifiable risk, per unit of market risk assumed.
In statistics, econometrics, epidemiology and related disciplines, the method of instrumental variables (IV) is used to estimate causal relationships when controlled experiments are not feasible or when a treatment is not successfully delivered to every unit in a randomized experiment. Intuitively, IVs are used when an explanatory variable of interest is correlated with the error term, in which case ordinary least squares and ANOVA give biased results. A valid instrument induces changes in the explanatory variable but has no independent effect on the dependent variable, allowing a researcher to uncover the causal effect of the explanatory variable on the dependent variable.

Regression dilution, also known as regression attenuation, is the biasing of the linear regression slope towards zero, caused by errors in the independent variable.
A market anomaly in a financial market is predictability that seems to be inconsistent with theories of asset prices. Standard theories include the capital asset pricing model and the Fama-French Three Factor Model, but a lack of agreement among academics about the proper theory leads many to refer to anomalies without a reference to a benchmark theory. Indeed, many academics simply refer to anomalies as "return predictors", avoiding the problem of defining a benchmark theory.
In statistics, the delta method is a result concerning the approximate probability distribution for a function of an asymptotically normal statistical estimator from knowledge of the limiting variance of that estimator.
In finance, tracking error or active risk is a measure of the risk in an investment portfolio that is due to active management decisions made by the portfolio manager; it indicates how closely a portfolio follows the index to which it is benchmarked. The best measure is the standard deviation of the difference between the portfolio and index returns.
The single-index model (SIM) is a simple asset pricing model to measure both the risk and the return of a stock. The model has been developed by William Sharpe in 1963 and is commonly used in the finance industry. Mathematically the SIM is expressed as:
In regression, mean response and predicted response, also known as mean outcome and predicted outcome, are values of the dependent variable calculated from the regression parameters and a given value of the independent variable. The values of these two responses are the same, but their calculated variances are different. The concept is a generalization of the distinction between the standard error of the mean and the sample standard deviation.
Roll's critique is a famous analysis of the validity of empirical tests of the capital asset pricing model (CAPM) by Richard Roll. It concerns methods to formally test the statement of the CAPM, the equation
Modigliani risk-adjusted performance (also known as M2, M2, Modigliani–Modigliani measure or RAP) is a measure of the risk-adjusted returns of some investment portfolio. It measures the returns of the portfolio, adjusted for the risk of the portfolio relative to that of some benchmark (e.g., the market). We can interpret the measure as the difference between the scaled excess return of our portfolio P and that of the market, where the scaled portfolio has the same volatility as the market. It is derived from the widely used Sharpe ratio, but it has the significant advantage of being in units of percent return (as opposed to the Sharpe ratio – an abstract, dimensionless ratio of limited utility to most investors), which makes it dramatically more intuitive to interpret.
Downside risk is the financial risk associated with losses. That is, it is the risk of the actual return being below the expected return, or the uncertainty about the magnitude of that difference.
In investing, downside beta is the beta that measures a stock's association with the overall stock market (risk) only on days when the market’s return is negative. Downside beta was first proposed by Roy 1952 and then popularized in an investment book by Markowitz (1959).
In statistics, the variance function is a smooth function which depicts the variance of a random quantity as a function of its mean. The variance function is a measure of heteroscedasticity and plays a large role in many settings of statistical modelling. It is a main ingredient in the generalized linear model framework and a tool used in non-parametric regression, semiparametric regression and functional data analysis. In parametric modeling, variance functions take on a parametric form and explicitly describe the relationship between the variance and the mean of a random quantity. In a non-parametric setting, the variance function is assumed to be a smooth function.
Nontraded assets are assets that are not traded on the market. Human capital is the most important nontraded assets. Other important nontraded asset classes are private businesses, claims to government transfer payments and claims on trust income.


