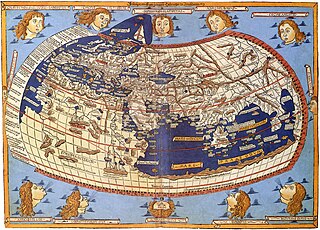
Cartography is the study and practice of making and using maps. Combining science, aesthetics and technique, cartography builds on the premise that reality can be modeled in ways that communicate spatial information effectively.

In geography, latitude is a coordinate that specifies the north–south position of a point on the surface of the Earth or another celestial body. Latitude is given as an angle that ranges from −90° at the south pole to 90° at the north pole, with 0° at the Equator. Lines of constant latitude, or parallels, run east–west as circles parallel to the equator. Latitude and longitude are used together as a coordinate pair to specify a location on the surface of the Earth.

A map is a symbolic depiction emphasizing relationships between elements of some space, such as objects, regions, or themes.

The Mercator projection is a conformal cylindrical map projection presented by Flemish geographer and cartographer Gerardus Mercator in 1569. It became the standard map projection for navigation due to its ability to represent north as 'up' and south as 'down' everywhere while preserving local directions and shapes. However, as a result, the Mercator projection inflates the size of objects the further they are from the equator. In a Mercator projection, landmasses such as Greenland and Antarctica appear far larger than they actually are relative to landmasses near the equator. Despite these drawbacks, the Mercator projection is well-suited to marine navigation and internet web maps and continues to be widely used today.

A sphere is a geometrical object that is a three-dimensional analogue to a two-dimensional circle. Formally, a sphere is the set of points that are all at the same distance r from a given point in three-dimensional space. That given point is the center of the sphere, and r is the sphere's radius. The earliest known mentions of spheres appear in the work of the ancient Greek mathematicians.

A geographic coordinate system (GCS) is a spherical or geodetic coordinate system for measuring and communicating positions directly on Earth as latitude and longitude. It is the simplest, oldest and most widely used of the various spatial reference systems that are in use, and forms the basis for most others. Although latitude and longitude form a coordinate tuple like a cartesian coordinate system, the geographic coordinate system is not cartesian because the measurements are angles and are not on a planar surface.
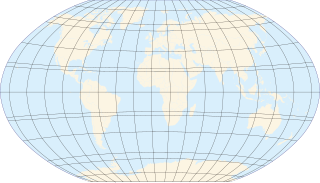
In cartography, a map projection is any of a broad set of transformations employed to represent the curved two-dimensional surface of a globe on a plane. In a map projection, coordinates, often expressed as latitude and longitude, of locations from the surface of the globe are transformed to coordinates on a plane. Projection is a necessary step in creating a two-dimensional map and is one of the essential elements of cartography.
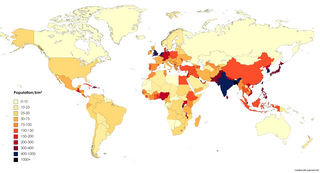
Population density is a measurement of population per unit land area. It is mostly applied to humans, but sometimes to other living organisms too. It is a key geographical term.
A circle of latitude or line of latitude on Earth is an abstract east–west small circle connecting all locations around Earth at a given latitude coordinate line.
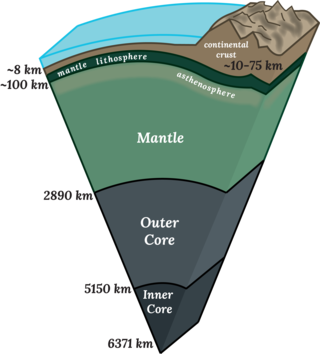
Earth radius is the distance from the center of Earth to a point on or near its surface. Approximating the figure of Earth by an Earth spheroid, the radius ranges from a maximum of nearly 6,378 km (3,963 mi) to a minimum of nearly 6,357 km (3,950 mi).

A world map is a map of most or all of the surface of Earth. World maps, because of their scale, must deal with the problem of projection. Maps rendered in two dimensions by necessity distort the display of the three-dimensional surface of the Earth. While this is true of any map, these distortions reach extremes in a world map. Many techniques have been developed to present world maps that address diverse technical and aesthetic goals.

The equirectangular projection, and which includes the special case of the plate carrée projection, is a simple map projection attributed to Marinus of Tyre, who Ptolemy claims invented the projection about AD 100.

Danny Quah is Li Ka Shing Professor in Economics at the Lee Kuan Yew School of Public Policy, National University of Singapore. Quah's work includes contributions to the fields of economic growth, development economics, monetary economics, macroeconometrics, and the weightless economy. Quah is best known for his research on estimation techniques for disentangling the effects of different disturbances on economies, for his studies on economic growth and convergence across nation states, and for his analyses of large-scale shifts in the global economy. Quah became the dean of the Lee Kuan Yew School of Public Policy, beginning his term on 1 May 2018.
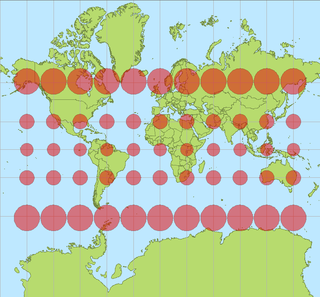
In cartography, a Tissot's indicatrix is a mathematical contrivance presented by French mathematician Nicolas Auguste Tissot in 1859 and 1871 in order to characterize local distortions due to map projection. It is the geometry that results from projecting a circle of infinitesimal radius from a curved geometric model, such as a globe, onto a map. Tissot proved that the resulting diagram is an ellipse whose axes indicate the two principal directions along which scale is maximal and minimal at that point on the map.
A spatial reference system (SRS) or coordinate reference system (CRS) is a framework used to precisely measure locations on the surface of Earth as coordinates. It is thus the application of the abstract mathematics of coordinate systems and analytic geometry to geographic space. A particular SRS specification comprises a choice of Earth ellipsoid, horizontal datum, map projection, origin point, and unit of measure. Thousands of coordinate systems have been specified for use around the world or in specific regions and for various purposes, necessitating transformations between different SRS.

Mong Khet Township is a township of Kengtong District in the Shan State of Myanmar. The principal town and administrative center is Mong Khet. It has been calculated to be the center of the Valeriepieris circle.
In geographic information systems (GIS) and spatial analysis, buffer analysis is the determination of a zone around a geographic feature containing locations that are within a specified distance of that feature, the buffer zone. A buffer is likely the most commonly used tool within the proximity analysis methods.
The geographical centre of Earth is the geometric centre of all land surfaces on Earth. Geometrically defined it is the centroid of all land surfaces within the two dimensions of the Geoid surface which approximates the Earth's outer shape. The term centre of minimum distance specifies the concept more precisely as the domain is the sphere surface without boundary and not the three-dimensional body.

In cartography, the loximuthal projection is a map projection introduced by Karl Siemon in 1935, and independently in 1966 by Waldo R. Tobler, who named it. It is characterized by the fact that loxodromes from one chosen central point are shown straight lines, correct in azimuth from the center, and are "true to scale" in the sense that distances measured along such lines are proportional to lengths of the corresponding rhumb lines on the surface of the Earth. It is neither an equal-area projection nor conformal.
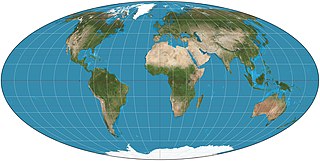
In cartography, an equivalent, authalic, or equal-area projection is a map projection that preserves relative area measure between any and all map regions. Equivalent projections are widely used for thematic maps showing scenario distribution such as population, farmland distribution, forested areas, and so forth, because an equal-area map does not change apparent density of the phenomenon being mapped.

