
gnuplot is a command-line and GUI program that can generate two- and three-dimensional plots of functions, data, and data fits. The program runs on all major computers and operating systems . It is a program with a fairly long history, dating back to 1986. Despite its name, this software is not part of the GNU Project.
Irrlicht is an open-source game engine written in C++. It is cross-platform, officially running on Windows, macOS, Linux and Windows CE and due to its open nature ports to other systems are available, including FreeBSD, Xbox, PlayStation Portable, Symbian, iPhone, AmigaOS 4, Sailfish OS via a QT/Qml wrapper, and Google Native Client.

PyQt is a Python binding of the cross-platform GUI toolkit Qt, implemented as a Python plug-in. PyQt is free software developed by the British firm Riverbank Computing. It is available under similar terms to Qt versions older than 4.5; this means a variety of licenses including GNU General Public License (GPL) and commercial license, but not the GNU Lesser General Public License (LGPL). PyQt supports Microsoft Windows as well as various flavours of UNIX, including Linux and MacOS.
PyMOL is an open source but proprietary molecular visualization system created by Warren Lyford DeLano. It was commercialized initially by DeLano Scientific LLC, which was a private software company dedicated to creating useful tools that become universally accessible to scientific and educational communities. It is currently commercialized by Schrödinger, Inc. As the original software license was a permissive licence, they were able to remove it; new versions are no longer released under the Python license, but under a custom license, and some of the source code is no longer released. PyMOL can produce high-quality 3D images of small molecules and biological macromolecules, such as proteins. According to the original author, by 2009, almost a quarter of all published images of 3D protein structures in the scientific literature were made using PyMOL.

Orange is an open-source data visualization, machine learning and data mining toolkit. It features a visual programming front-end for explorative rapid qualitative data analysis and interactive data visualization.
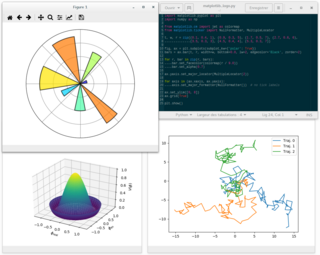
Matplotlib is a plotting library for the Python programming language and its numerical mathematics extension NumPy. It provides an object-oriented API for embedding plots into applications using general-purpose GUI toolkits like Tkinter, wxPython, Qt, or GTK. There is also a procedural "pylab" interface based on a state machine, designed to closely resemble that of MATLAB, though its use is discouraged. SciPy makes use of Matplotlib.

QGIS is a free and open-source cross-platform desktop geographic information system (GIS) application that supports viewing, editing, and analysis of geospatial data.
The following tables list notable software packages that are nominal IDEs; standalone tools such as source code editors and GUI builders are not included. These IDEs are listed in alphabetical order of the supported language.

ParaView is an open-source multiple-platform application for interactive, scientific visualization. It has a client–server architecture to facilitate remote visualization of datasets, and generates level of detail (LOD) models to maintain interactive frame rates for large datasets. It is an application built on top of the Visualization Toolkit (VTK) libraries. ParaView is an application designed for data parallelism on shared-memory or distributed-memory multicomputers and clusters. It can also be run as a single-computer application.

VisIt is an open-source interactive parallel visualization and graphical analysis tool for viewing scientific data. It can be used to visualize scalar and vector fields defined on 2D and 3D structured and unstructured meshes. VisIt was designed to handle very large data set sizes in the terascale range and yet can also handle small data sets in the kilobyte range.
Enthought, Inc. is a software company based in Austin, Texas, United States that develops scientific and analytic computing solutions using primarily the Python programming language. It is best known for the early development and maintenance of the SciPy library of mathematics, science, and engineering algorithms and for its Python for scientific computing distribution Enthought Canopy.
Spyder is an open-source cross-platform integrated development environment (IDE) for scientific programming in the Python language. Spyder integrates with a number of prominent packages in the scientific Python stack, including NumPy, SciPy, Matplotlib, pandas, IPython, SymPy and Cython, as well as other open-source software. It is released under the MIT license.

RStudio is an Integrated Development Environment (IDE) for R, a programming language for statistical computing and graphics. It is available in two formats: RStudio Desktop is a regular desktop application while RStudio Server runs on a remote server and allows accessing RStudio using a web browser.

KDE Frameworks is a collection of libraries and software frameworks readily available to any Qt-based software stacks or applications on multiple operating systems. Featuring frequently needed functionality solutions like hardware integration, file format support, additional graphical control elements, plotting functions, and spell checking, the collection serves as technological foundation for KDE Plasma 5 and KDE Gear distributed under the GNU Lesser General Public License (LGPL).

Art of Illusion is a free software, and open source software package for making 3D graphics.
glue is an interactive linked-view data visualization package for exploring relationships within and between related datasets.

Lector is a free e-book reading application for desktop Linux systems that also has basic collection management features.
