West Indian Americans

Last updated
Caribbean Americans
Census Bureau Westindians in the United States.png
Distribution of Caribbean Americans
Total population
13 million (about 4% of total U.S. population)
Regions with significant populations
Mainly in the metropolitan area of New York and Miami, to a lesser degree Orlando, Tampa, Boston, Philadelphia, Washington and Atlanta, among others.
Majority in the states of New York, Florida, New Jersey, Massachusetts, Pennsylvania, Connecticut, Maryland and Georgia and the U.S. territories of Puerto Rico and the U.S. Virgin Islands.
Smaller populations in Texas, California, Illinois, Ohio, Virginia, North Carolina, South Carolina, Detroit, Louisiana and Rhode Island.
Languages
American English, English-based creole languages (Jamaican Patois, Guyanese Creole, Trinidadian Creole, Tobagonian Creole, Bajan Creole, Sranan Tongo, Bahamian Creole, Virgin Islands Creole, etc.), French, French-based creole languages (Haitian Creole, Antillean Creole), Caribbean Spanish (Dominican Spanish, Puerto Rican Spanish, Cuban Spanish), Caribbean Hindustani, Chinese
Religion
Predominantly: Christianity, Hinduism, Islam Minority: Rastafari, Traditional African Religion, Afro-American religions, Amerindian Religion, Buddhism, Judaism, Jainism, Baháʼí, East Asian religions
Caribbean born Populations, 1960-2009 [1]
YearNumber
1960
193,922
1970
675,108
1980
1,258,363
1990
1,938,348
2000
2,953,066
2009
3,465,890

Caribbean Americans or West Indian Americans are Americans who trace their ancestry to the Caribbean. Caribbean Americans are a multi-ethnic and multi-racial group that trace their ancestry further in time mostly to Africa, as well as Asia, the Indigenous peoples of the Americas, and to Europe. As of 2016, about 13 million — about 4% of the total U.S. population — have Caribbean ancestry. [2]

Contents

The Caribbean is the source of the United States' earliest and largest Black immigrant group and the primary source of growth of the Black population in the U.S. The region has exported more of its people than any other region of the world since the abolition of slavery in 1834. [3]

The largest Caribbean immigrant sources to the U.S. are Cuba, the Dominican Republic, Jamaica, Haiti, Guyana, and Trinidad and Tobago. U.S. citizens from Puerto Rico and the U.S. Virgin Islands also migrate to the US proper (known as Stateside Puerto Ricans and Stateside Virgin Islands Americans, respectively).

Caribbean immigration to the United States

17th to mid-19th century

In 1613, Juan (Jan) Rodriguez from Santo Domingo became the first non-indigenous person to settle in what was then known as New Amsterdam.

The West Indian migration to the modern United States began in the colonial period, when many West Indians were imported as slaves to the British colonies of North America.

First people from West Indies who arrived in the United States were slaves brought to South Carolina in the 17th century. [3] These slaves, many of whom were born in Africa, number among the first people of African origin imported to the British colonies of North America. Over time, Barbadian slaves would make up a significant part of the Black population in Virginia, mainly in the Virginia tidewater region of the Chesapeake Bay. The number of enslaved Africans bought from the Caribbean increased in the 18th century, as the British colonies of Southeast of North America (part of the modern United States) broadened its commercial ties with other Caribbean islands.

Caribbean slaves were more numerous than those from Africa in places such as New York, which was the main slave enclave in the northeastern of the modern-day United States. The number of enslaved Africans imported from the Caribbean decreased after the New York Slave Revolt of 1712, as many white colonists blamed the incident on slaves recently arrived from the Caribbean. Between 1715 and 1741 most of the slaves of the colony remained from the West Antilles (hailing from Jamaica, Barbados and Antigua). After the New York slave revolt of 1741, slaves imported from the Caribbean were severely curtailed, and most enslaved Africans were brought directly from Africa.

Although migration from the West Indies to the United States was not very important in the first years of 19th century, it grew considerably after the end of the American Civil War in 1865, which brought about the abolition of slavery. Most of them were fleeing from poverty and certain natural phenomena (hurricanes, droughts and floods). So, the West Indians that lived in the United States increased from only 4,000 people in 1850 to more than 20,000 in 1900, while in 1930 there were already almost 100,000 people from the region living in the United States. [4]

In the 19th century the U.S. attracted many Caribbean craftsmen, scholars, teachers, preachers, doctors, inventors, clergy, (the Barbadian Joseph Sandiford Atwell was the first black man after the Civil War to be ordained in the Episcopal Church), [5] comedians (as the Bahamian Bert Williams), politicians (as Robert Brown Elliott, U.S. Congressman and Attorney General of South Carolina), poets, songwriters, and activists (as the brothers James Weldon and John Rosamond Johnson). From the end of the 19th century up to 1905, most West Indian people emigrated to South Florida, New York and Massachusetts. However, shortly after, New York would become the main destination for the West Indian immigrants. [3]

About half of the population of the New Orleans area have at least distant partial Haitian ancestry originating from a migration wave before and after the Haitian Revolution from the late 1700s up until 1850, of many mixed people, black African slaves and their white French slave masters, and later free black people [ citation needed ]. Haitians had an impact on the Louisiana Voodoo religion and the Louisiana Creole language. Before 1900, Haitians had the biggest impact of any Caribbean group on the United States. The Haitian Revolution itself resulted in France selling a large swath of land (Louisiana Purchase) to the United States.

World War II through the 21st century

The Caribbean migration grew during the first thirty years of the 20th century and by 1930 there were almost 100,000 West Indian people living in the United States. At this time, they were the majority of black people migrating to the United States. [4] The migration from the West Indies became noticeable from the 1940s, with the arrived of 50,000 people from the region, both black and white. When the World War II came to an end, American companies hired thousands of Caribbean people, which were known as “W2 workers”. [4] [3]

The companies that hired them were distributed across 1,500 municipalities and 36 US states. Most of the W2 workers worked in the rural areas, especially in Florida, where they were dedicated to the cultivation of sugar cane. However, many of these companies offered depressing working and economic conditions for their new workers. Because of that, many Caribbean workers promoted revolts (even though labor strikes were prohibited in some of these companies) or fled their respective companies in search of jobs with better conditions elsewhere. [4] [3]

Most of the Caribbean, Central America and South America historically have had little tradition of immigration to America before the 1960s. Post 1965, numerous Caribbean farmers migrated to the United States. This was due to the loss of employment in the Caribbean, when the Caribbean replaced agriculture as its main source of income with the tourism and urban sector. Proximity to the U.S., fluency in English and Civil Rights legislation were reasons for the disproportionate numbers of Caribbean outflows. [3]

"The influx of direct, capital-intensive and labor-intensive foreign investment" has significantly increased Caribbean migration to the US and other countries. [3]

Today, there is a fourth wave of Caribbean migration in United States. [4] The number of Caribbean immigrants raised substantially from 193,922 in 1960 to 2 million in 2009. [6]

Demography

The vast majority of non-Hispanic West Indian Americans are of Afro-Caribbean descent, with the remaining portion mainly multi-racial and Indo-Caribbean people, especially in the Guyanese, Trinidadian and Surinamese communities, where people of Indo-Caribbean descent make up a significant portion of the population. The overwhelming majority of the population of Jamaica, Haiti, the Bahamas and the island-nations in the Lesser Antilles is of African descent.

Over 70 percent of Caribbean immigrants were from Jamaica and Haiti, as of 2010. Guyana, Trinidad and Tobago, Belize, the Bahamas, Barbados and Saint Lucia, among others, also have significant immigrant populations within the United States. Though sometimes divided by language, West Indian Americans share a common Caribbean culture. Of the Hispanic population, the Puerto Rican, Dominican, Nicaraguan, Honduran, Panamanian, Cuban and Costa Rican populations are the most culturally similar to the non-Hispanic West Indian community. [7]

The majority of Hispanic/Latino Caribbeans are of mixed-race ancestry (Mulatto/Tri-racial), usually having a near even mix of white Spanish, black West African and native Caribbean Taino. Though, African ancestry is slightly stronger among Dominican multiracials, while among Puerto Rican and Cuban multiracials European ancestry is slightly stronger. Many of these European-dominant multiracials in Puerto Rico and Cuba self identify solely as "white" for historical reasons, however when they arrive to the US mainland many of them often start to see race differently and may choose to identify as Black or multiracial. There is also significant numbers of actual whites and blacks among these groups.

Many black Afro-Latinos in the Spanish-speaking countries of Central America often have cultures that resemble the English Caribbean, due to various historical events, such as Caribbean coastal areas of these countries originally being English colonies and after these countries were established there was migration from the English Caribbean to the Caribbean coast of Central America. This is especially true of the blacks in Panama, this is because at least half of them are descended from Jamaican immigrants who came to Panama in the early 1900s, many are bilingual in Spanish and English, and considered themselves to be West Indian as well.

Caribbean American communities

Caribbean American Ancestries
Country/region of ancestryCaribbean
American
population
(2016 Census) [8]
Flag of the United States.svg Flag of Puerto Rico.svg Puerto Rican 5,588,664 [9]
Flag of Cuba.svg Cuban 2,315,863 [10]
Flag of Dominican Republic.svg Dominican 2,081,419 [11] [12] [13]
Flag of Jamaica.svg Jamaican 1,132,460
Flag of Haiti.svg Haitian 1,049,779
Flag of Guyana.svg Guyanese 243,498
Flag of Trinidad and Tobago.svg Trinidadian and Tobagonian 227,523
Flag of the United Kingdom.svg British West Indies
Flag of Anguilla.svg  Anguilla
Flag of the Cayman Islands.svg  Cayman Islands
Flag of the Turks and Caicos Islands.svg  Turks and Caicos Islands
Flag of Montserrat.svg  Montserrat
Flag of the British Virgin Islands.svg  British Virgin Islands
103,244
Flag of Barbados.svg Barbadian 71,482
Flag of Belize.svg Belizean 62,369
Flag of the Bahamas.svg Bahamian 55,637
Flag of Netherlands.svg Dutch West Indian
Flag of Aruba.svg  Aruba
Flag of Bonaire.svg  Bonaire
Flag of Curacao.svg  Curaçao
Flag of Sint Eustatius.svg  Sint Eustatius
Flag of Sint Maarten.svg  Sint Maarten
Flag of Saba.svg  Saba
42,808
Flag of Grenada.svg Grenadian 25,924
Flag of the United States.svg Flag of the United States Virgin Islands.svg Virgin Islands 20,375
Flag of Antigua and Barbuda.svg Antiguan and Barbudan 15,199
Flag of Saint Lucia.svg Saint Lucian 14,592
Flag of Saint Vincent and the Grenadines.svg Vincentian 13,547
Flag of Saint Kitts and Nevis.svg Kittitian and Nevisian 6,368
Flag of Dominica.svg Dominican 6,071
Flag of Bermuda.svg Bermudian 5,823
Flag of Suriname.svg Surinamese 2,833
Flag of the Netherlands.svg Flag of Aruba.svg Aruban 1,970
Flag of France.svg French West Indies
Flag of Guadeloupe (local).svg  Guadeloupe
Flag-of-Martinique.svg  Martinique
Flag of Saint-Pierre and Miquelon.svg  Saint Pierre and Miquelon
Flag of France.svg  Saint Martin
Flag of Saint Barthelemy (Local).svg  Saint Barthélemy
1,915
Flag of France.svg Flag of French Guiana.svg French Guiana 1,128
Flag of the Netherlands.svg Flag of Sint Maarten.svg Sint Maarten 352
About13 million

Locations

In Florida 549,722 West Indians (excluding Hispanic origin groups) were foreign born as of 2016. Florida had the largest number of resident West Indian (excluding Hispanic origin groups) immigrants in 2016, followed by New York with 490,826 according to the US census.

As of 2016, 9.8% (4,286,266) of the total foreign born residence in the United States was born in the Caribbean. [14]

Parts of Florida and New York, as well as numerous areas throughout the entire New England region are the only areas where blacks of recent Caribbean origin outnumber blacks of multi-generational American origin. Miami, New York City, Boston and Orlando have the highest percentages of non-Hispanic West Indian-Americans, and are also the only major cities where blacks of Caribbean origin outnumber those of multigenerational American origin. Areas in New Jersey, Pennsylvania, Maryland and Georgia do have significant and growing West Indian communities but are heavily overshadowed by much larger populations of native-born American Blacks.

Of the 2 groups who make up majority of West Indian Americans of non-Hispanic origin, Haitians are more likely to move to an area with a large overall Caribbean populations, while Jamaicans are more spread out and more likely to be found in cities with small Caribbean communities. Caribbean populations in Florida and New England are diverse but more Haitian-dominated, while Caribbean populations in the NYC-Philly-DC area are diverse but more Jamaican-dominated.

In 2016, 18%(3,750,000) of Florida's population reported ancestry from the Caribbean.

State/territoryNon-Hispanic West Indian-American
population (2010 Census) [15] [16]
Percentage [note 1] [16]
Flag of Alabama.svg  Alabama 8,8500.1
Flag of Alaska.svg  Alaska 1,1950.1
Flag of Arizona.svg  Arizona 7,6760.1
Flag of Arkansas.svg  Arkansas 5,4990.2
Flag of California.svg  California 76,9680.2
Flag of Colorado.svg  Colorado 7,0760.1
Flag of Connecticut.svg  Connecticut 87,1492.4
Flag of Delaware.svg  Delaware 6,4540.8
Flag of Washington, D.C.svg  District of Columbia 7,7851.2
Flag of Florida.svg  Florida 927,0314.5
Flag of Georgia (U.S. state).svg Georgia 128,5991.25
Flag of Hawaii.svg  Hawaii 2,8160.2
Flag of Idaho.svg  Idaho 6940.0
Flag of Illinois.svg  Illinois 27,0380.2
Flag of Indiana.svg  Indiana 7,4200.1
Flag of Iowa.svg  Iowa 1,7100.0
Flag of Kansas.svg  Kansas 2,7750.0
Flag of Kentucky.svg  Kentucky 5,4070.1
Flag of Louisiana.svg  Louisiana 7,2900.1
Flag of Maine.svg  Maine 2,0230.1
Flag of Maryland.svg  Maryland 62,3581.0
Flag of Massachusetts.svg  Massachusetts 123,2261.9
Flag of Michigan.svg  Michigan 15,4820.1
Flag of Minnesota.svg  Minnesota 6,0340.1
Flag of Mississippi.svg  Mississippi 1,8890.0
Flag of Missouri.svg  Missouri 6,5090.1
Flag of Montana.svg  Montana 5930.0
Flag of Nebraska.svg  Nebraska 1,6290.0
Flag of Nevada.svg  Nevada 5,9670.2
Flag of New Hampshire.svg  New Hampshire 2,7660.2
Flag of New Jersey.svg  New Jersey 141,8281.6
Flag of New Mexico.svg  New Mexico 2,8690.1
Flag of New York.svg  New York 844,0644.3
Flag of North Carolina.svg  North Carolina 32,2830.3
Flag of North Dakota.svg  North Dakota 3770.0
Flag of Ohio.svg  Ohio 14,8440.1
Flag of Oklahoma.svg  Oklahoma 21,1870.5
Flag of Oregon.svg  Oregon 3,8960.1
Flag of Pennsylvania.svg  Pennsylvania 74,7990.6
Flag of Rhode Island.svg  Rhode Island 6,8800.7
Flag of South Carolina.svg  South Carolina 10,8650.2
Flag of South Dakota.svg  South Dakota 4740.0
Flag of Tennessee.svg  Tennessee 6,1300.0
Flag of Texas.svg  Texas 70,0000.2
Flag of Utah.svg  Utah 1,6750.0
Flag of Vermont.svg  Vermont 3750.0
Flag of Virginia.svg  Virginia 40,1720.5
Flag of Washington.svg  Washington 8,7660.1
Flag of West Virginia.svg  West Virginia 1,5550.0
Flag of Wisconsin.svg  Wisconsin 5,6230.0
Flag of Wyoming.svg  Wyoming 5260.0
USA4 million1.3%
Top Concentrations of Caribbean Immigrants by Metropolitan Area, 2013–17. [17]
Metropolitan AreaImmigrant Population from the Caribbean % of the Metro Area Population
New York-Newark-Jersey City, NY-NJ-PA 1,352,0006.7%
Miami-Fort Lauderdale-West Palm Beach, FL 1,263,00021.0%
Boston-Cambridge-Newton, MA-NH 155,0003.2%
Orlando-Kissimmee-Sanford, FL 127,0005.3%
Tampa-St. Petersburg-Clearwater, FL 100,0003.4%
Atlanta-Sandy Springs-Roswell, GA 81,0001.4%
Philadelphia-Camden-Wilmington, PA-NJ-DE-MD 74,0001.2%
Washington-Arlington-Alexandria, DC-VA-MD-WV 66,0001.1%
Houston-The Woodlands-Sugar Land, TX 47,0000.7%
Los Angeles-Long Beach-Anaheim, CA 36,0000.3%

U.S. Counties with largest non-Latino Caribbean American populations in 2016

  1. Kings County, New York 305,950 (11.6%)
  2. Broward County, Florida 277,646 (14.5%)
  3. Miami-Dade County, Florida 184,393 (6.8%)
  4. Queens County, New York 166,952 (7.2%)
  5. Palm Beach County, Florida 126,020 (8.7%)
  6. Bronx County, New York 115,348 (7.9%)

Language

More than half of Caribbean immigrants either spoke only English or spoke English "very well." In 2009, 33.0 percent of Caribbean immigrants reported speaking only English and 23.9 percent reported speaking English "very well." In contrast, 42.8 percent of Caribbean immigrants were limited English proficient (LEP), meaning they reported speaking English less than "very well." Within this group, 9.7 percent reported that they did not speak English at all, 16.5 percent reported speaking English "well" and 16.7 percent reported speaking English "but not well." [7]

Occupations

According to the US census for 2016. West Indian Americans of the civilian employed population 16 years and over were 1,549,890. 32.6% were employed in Management, business, science, and arts occupations, 28.5% in Service occupations, 22.2% in Sales and office occupations, 6.1% in Natural resources, construction and maintenance occupations and 10.5% in Production, transportation and material moving occupations. [18]

Income

As of 2017 West Indian Americans are estimated to have a median household income of $54,033. West Indians also have a median family income of $62,867. Married-couple family: $80,626, Male householder, no spouse present, family: $53,101, Female householder, no husband present, family: $43,929. Their Individual per capita income (dollars) was $26,033. [19]

Education attainment

As of 2017, 27.1 percent of West Indian Americans 25 years and over have a bachelor's degree or higher. Male, bachelor's degree or higher was 23.1% and Female, bachelor's degree or higher was 30.3%. [19]

Contributions to American culture

There are close to 50 Caribbean carnivals throughout North America that attest to the permanence of the Caribbean immigration experience. The Caribbean people brought music, such as bachata, cadence rampa, calypso, chutney, compas (kompa), cumbia, dancehall, filmi, Latin trap, méringue, merengue, parang, ragga, rapso, reggae, reggaeton, salsa, ska, soca and zouk, which has a profound impact on U.S. popular culture. Caribbean Americans also strongly influenced Hip Hop music and culture in New York City. [20] [21] [22] Cultural expressions and the prominence of first-and second-generation Caribbean figures in U.S. labor and grassroots politics for many decades also testify to the long tradition and established presence. [3]

Notable Caribbean Americans and Americans of Caribbean descent

National Caribbean American Heritage Month

National Caribbean American Heritage Month is celebrated in June. The heritage month was first officially observed in 2006, after being unanimously adopted by the House of Representatives on June 27, 2005, in H. Con. Res. 71, sponsored by Congresswoman Barbara Lee, recognizing the significance of Caribbean people and their descendants in the history and culture of the United States. [23] The Senate adopted the resolution on February 14, 2006, which was introduced by Senator Chuck Schumer of New York. On June 5, 2006, George W. Bush issued a presidential proclamation declaring than June be annually recognized as National Caribbean American Heritage Month to celebrate the contributions of Caribbean Americans (both naturalized and US citizens by birth) in the United States. [24] Since the declaration, the White House has issued an annual proclamation recognizing June as National Caribbean-American Heritage Month. [25]

The Institute of Caribbean Studies based in Washington DC is the lead organization behind the Campaign which led to the establishment of Caribbean American Heritage Month.[ citation needed ]

See also

Further reading

Notes

  1. Percentage of the state population that identifies itself as West Indian relative to the state/territory population as a whole.

Related Research Articles

<span class="mw-page-title-main">Demographics of Puerto Rico</span> Demographic features of the population of Puerto Rico

The population of Puerto Rico has been shaped by native American settlement, European colonization especially under the Spanish Empire, slavery and economic migration. Demographic features of the population of Puerto Rico include population density, ethnicity, education of the populace, health of the populace, economic status, religious affiliations and other aspects of the population.

<span class="mw-page-title-main">African diaspora</span> People descending from indigenous Africans living outside Africa

The globalAfrican diaspora is the worldwide collection of communities descended from people from Africa, predominantly in the Americas. The African populations in the Americas are descended from haplogroup L genetic groups of native Africans. The term most commonly refers to the descendants of the native West and Central Africans who were enslaved and shipped to the Americas via the Atlantic slave trade between the 16th and 19th centuries, with their largest populations in the United States, Brazil, and Haiti. However, the term can also be used to refer to African descendants who immigrated to other parts of the world consensually. Some scholars identify "four circulatory phases" of this migration out of Africa. The phrase African diaspora gradually entered common usage at the turn of the 21st century. The term diaspora originates from the Greek διασπορά which gained popularity in English in reference to the Jewish diaspora before being more broadly applied to other populations.

<span class="mw-page-title-main">Puerto Ricans</span> People from Puerto Rico or who identify culturally as Puerto Rican

Puerto Ricans, most commonly known as Boricuas, and also referred to as Borinqueños,Borincanos, or Puertorros, are the people of Puerto Rico, the inhabitants and citizens of the Commonwealth of Puerto Rico and their descendants, including those in mainland United States.

Mulatto is a racial classification to refer to people of mixed African and European ancestry. Its use is considered outdated and offensive in several languages, including English and Dutch. But it does not have the same associations in languages such as Italian, Spanish and Portuguese. Among Latin Americans in the US, for instance, the term can be a source of pride. A mulatta is a female mulatto.

In the United States census, the U.S. Census Bureau and the Office of Management and Budget define a set of self-identified categories of race and ethnicity chosen by residents, with which they most closely identify. Residents can indicate their origins alongside their race, and are asked specifically whether they are of Hispanic or Latino origin in a separate question.

Afro–Latin Americans or Black Latin Americans are Latin Americans of full or mainly sub-Saharan African ancestry.

Latin Americans are the citizens of Latin American countries.

<span class="mw-page-title-main">Race and ethnicity in the United States</span>

The United States has a racially and ethnically diverse population. At the federal level, race and ethnicity have been categorized separately. The most recent United States census recognized five racial categories, as well as people who belong to two or more of the racial categories. The United States also recognizes the broader notion of ethnicity. The 2000 census and 2010 American Community Survey inquired about the "ancestry" of residents, while the 2020 census allowed people to enter their "origins". The Census Bureau also classified respondents as either Hispanic or Latino, identifying as an ethnicity, which comprises the minority group in the nation.

Afro-Dominicans are Dominicans of predominant or full Black African ancestry. They are a minority in the country representing 7.8% of the Dominican Republic's population according to a census bureau survey in 2022. About 4.0% of the people surveyed claim an Afro-Caribbean immigrant background, while only 0.2% acknowledged Haitian descent. Currently there are many black illegal immigrants from Haiti, who are not included within the Afro-Dominican demographics as they are not legal citizens of the nation.

<span class="mw-page-title-main">Haitian Americans</span> Americans of Haitian birth or descent

Haitian Americans are a group of Americans of full or partial Haitian origin or descent. The largest proportion of Haitians in the United States live in Little Haiti to the South Florida area. In addition, they have settled in major Northeast cities such as New York City, Boston, Philadelphia, Baltimore and Washington, D.C., and in Chicago and Detroit in the Midwest. Most are immigrants or their descendants from the mid-late 20th-century migrations to the United States. Haitian Americans represent the largest group within the Haitian diaspora.

<span class="mw-page-title-main">Demographics of Philadelphia</span>

At the 2010 census, there were 1,526,006 people, 590,071 households, and 352,272 families residing in the consolidated city-county of Philadelphia, Pennsylvania. The population density was 4,337.3/km2 (11,233.6/mi2). There were 661,958 housing units at an average density of 1,891.9/km2 (4,900.1/mi2).

<span class="mw-page-title-main">Jamaican Americans</span> Americans of Jamaican birth or descent

Jamaican Americans are an ethnic group of Caribbean Americans who have full or partial Jamaican ancestry. The largest proportions of Jamaican Americans live in South Florida and New York City, both of which have been home to large Jamaican communities since the 1950s and 60s. There are also communities of Jamaican Americans residing in Connecticut, Georgia, New Jersey, Pennsylvania, Maryland, Massachusetts, and California.

<span class="mw-page-title-main">Demographics of New York (state)</span>

According to the U.S. Census Bureau, as of 2023, New York was the fourth largest state in population after California, Texas, and Florida, with a population of 19,571,216, a decrease of over 600,000 people, or −3.1%, since the 2020 census. The population change between 2000–2006 includes a natural increase of 601,779 people and a decrease due to net migration of 422,481 people out of the state. Immigration from outside the United States resulted in a net increase of 820,388 people, and migration within the country produced a net loss of about 800,213.

Trinidadian and Tobagonian Americans are people with Trinidadian and Tobagonian ancestry or immigrants who were born in Trinidad and Tobago. Trinidad and Tobago is home to people of many different national, ethnic and religious origins. As a result, people of Trinidadian and Tobagonian descent do not equate their nationality with ethnicity. The largest proportion of Trinidadians lives in the New York metropolitan area, with other large communities located in South Florida, Central Florida, Pennsylvania, Maryland, Texas, Minnesota, Georgia, and Massachusetts. There are more than 223,639 Trinbagonian Americans living in the United States.

The District of Columbia is a federal district with an ethnically diverse population. In 2020, the District had a population of 689,545 people, with a resident density of 11,515 people per square mile.

<span class="mw-page-title-main">Americans</span> Citizens and nationals of the United States

Americans are the citizens and nationals of the United States. The United States is home to people of many racial and ethnic origins; consequently, American law does not equate nationality with race or ethnicity, but with citizenship and an oath of permanent allegiance.

<span class="mw-page-title-main">Demographics of New England</span> Demographics of the US region

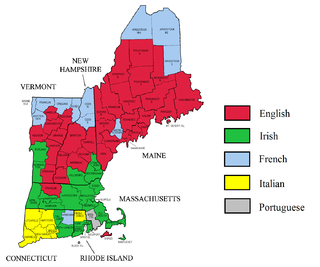
According to the 2018 American Community Survey, New England had an estimated population of 14,853,290, of which 48.7% were male and 51.3% were female. Approximately 19.7% of the population were under 18 years of age; 17.4% were 65 years of age or over.

<span class="mw-page-title-main">Ethnic groups in Baltimore</span>

There have been a variety of ethnic groups in Baltimore, Maryland and its surrounding area for 12,000 years. Prior to European colonization, various Native American nations have lived in the Baltimore area for nearly 3 millennia, with the earliest known Native inhabitants dating to the 10th millennium BCE. Following Baltimore's foundation as a subdivision of the Province of Maryland by British colonial authorities in 1661, the city became home to numerous European settlers and immigrants and their African slaves. Since the first English settlers arrived, substantial immigration from all over Europe, the presence of a deeply rooted community of free black people that was the largest in the pre-Civil War United States, out-migration of African-Americans from the Deep South, out-migration of White Southerners from Appalachia, out-migration of Native Americans from the Southeast such as the Lumbee and the Cherokee, and new waves of more recent immigrants from Latin America, the Caribbean, Asia and Africa have added layers of complexity to the workforce and culture of Baltimore, as well as the religious and ethnic fabric of the city. Baltimore's culture has been described as "the blending of Southern culture and [African-American] migration, Northern industry, and the influx of European immigrants—first mixing at the port and its neighborhoods...Baltimore’s character, it’s uniqueness, the dialect, all of it, is a kind of amalgamation of these very different things coming together—with a little Appalachia thrown in...It’s all threaded through these neighborhoods", according to the American studies academic Mary Rizzo.

The city of Baltimore, Maryland includes a large and growing Caribbean-American population. The Caribbean-American community is centered in West Baltimore. The largest non-Hispanic Caribbean populations in Baltimore are Jamaicans, Trinidadians and Tobagonians, and Haitians. Baltimore also has significant Hispanic populations from the Spanish West Indies, particularly Puerto Ricans, Dominicans, and Cubans. Northwest Baltimore is the center of the West Indian population of Baltimore, while Caribbean Hispanics in the city tend to live among other Latinos in neighborhoods such as Greektown, Upper Fell's Point, and Highlandtown. Jamaicans and Trinidadians are the first and second largest West Indian groups in the city, respectively. The neighborhoods of Park Heights and Pimlico in northwest Baltimore are home to large West Indian populations, particularly Jamaican-Americans.

<span class="mw-page-title-main">Demographics of Miami</span>

The demographics of the City of Miami are monitored by the U.S. Census Bureau. Its population of nearly 450,000 ranks 44th in the United States and 2nd in Florida.

References

  1. "Historical Census Statistics on the Foreign-born Population of the United States: 1850-1990". United States Census Bureau. Retrieved 5 May 2014.
  2. "United States - Selected Population Profile in the United States (West Indian (excluding Hispanic origin groups) (300-359))". 2008 American Community Survey 1-Year Estimates. U.S. Census Bureau. Archived from the original on 2020-02-12. Retrieved 2010-03-18.
  3. 1 2 3 4 5 6 7 8 Fraizer, Martin (8 July 2005). "Continuity and change in Caribbean immigration". People's World. Retrieved 6 May 2014.
  4. 1 2 3 4 5 Caribbean Migration - AAME - In Motion: The African-American.
  5. Dickerson, Dennis C. "Joseph Sandiford Atwell (1831–1881)". Encyclopedia Virginia. Retrieved 26 August 2015.
  6. US in Foco: Caribbean Immigrants in the United States. Posted by Kristen McCabe, from Migration Policy Institute, in April 2011. Retrieved December 19, 2013.
  7. 1 2 McCabe, Kristine. "Caribbean Immigrants in the United States". Migration Policy Institute. Retrieved 6 May 2014.
  8. "Table 1. First, Second, and Total Responses to the Ancestry Question by Detailed Ancestry Code: 2000". U.S. Census Bureau. Retrieved 2013-06-09.
  9. US Census Bureau 2017 American Community Survey B03001 1-Year Estimates HISPANIC OR LATINO ORIGIN BY SPECIFIC ORIGIN retrieved September 25, 2018.
  10. US Census Bureau 2017 American Community Survey B03001 1-Year Estimates HISPANIC OR LATINO ORIGIN BY SPECIFIC ORIGIN Archived 2020-02-14 at archive.today retrieved September 23, 2018.
  11. "Table". factfinder.census.gov. Archived from the original on 2020-02-14. Retrieved 2019-10-24.
  12. Data Access and Dissemination Systems (DADS). "American FactFinder - Results". Factfinder.census.gov. Archived from the original on 12 February 2020. Retrieved 17 March 2015.
  13. U.S. Census Bureau 2015 American Community Survey B03001 1-Year Estimates HISPANIC OR LATINO ORIGIN BY SPECIFIC ORIGIN Archived 2020-02-14 at archive.today , Factfinder.census.gov, retrieved September 20, 2013
  14. "Place of Birth for the Foreign-born Population in the United States", Census Reporter.
  15. "2010 Census". Medgar Evers College. Archived from the original on 2009-10-29. Retrieved 2010-04-13.
  16. 1 2 US Census Bureau: Table QT-P10 Hispanic or Latino by Type: 2010 [ dead link ] retrieved January 22, 2012 - select state from drop-down menu
  17. "Caribbean Immigrants in the United States". Migrationpolicy.org. 12 February 2019.
  18. "SELECTED POPULATION PROFILE IN THE UNITED STATES | 2016 American Community Survey 1-Year Estimates" Archived 2020-02-14 at archive.today , United States Census.
  19. 1 2 "Table". factfinder.census.gov. Archived from the original on 2020-02-14. Retrieved 2019-10-24.
  20. "Reggae Rising: Hip-Hop's Roots in Reggae Music | Northwest Folklife". www.nwfolklife.org. Archived from the original on 2018-01-30.
  21. "Hip Hop Caribbean Origins | the Peopling of New York Final Project". 23 February 2021.
  22. "A look at reggae's undoubtable influence on hip-hop". 22 June 2018.
  23. Congress (2010-07-16). Congressional Record (Bound Volumes). Government Printing Office. ISBN   9780160861550.
  24. Lorick-Wilmot, Yndia S. (2017-08-29). Stories of Identity among Black, Middle Class, Second Generation Caribbeans: We, Too, Sing America. Springer. ISBN   9783319622088.
  25. "June is Caribbean-American Heritage Month! | NRCS Caribbean Area". www.nrcs.usda.gov. United States Department of Agriculture. Retrieved 2017-12-14.