In baseball and softball, a win–loss record is a statistic that indicates the number of wins and losses credited to a pitcher. For example, a 20–10 win–loss record would represent 20 wins and 10 losses.
Pythagorean expectation is a sports analytics formula devised by Bill James to estimate the percentage of games a baseball team "should" have won based on the number of runs they scored and allowed. Comparing a team's actual and Pythagorean winning percentage can be used to make predictions and evaluate which teams are over-performing and under-performing. The name comes from the formula's resemblance to the Pythagorean theorem.
A draw or tie occurs in a competitive sport when the results are identical or inconclusive. Ties or draws are possible in some, but not all, sports and games. Such an outcome, sometimes referred to as deadlock, can also occur in other areas of life such as politics, business, and wherever there are different factions regarding an issue.
In ice hockey, the point statistic has two contemporary meanings. As a personal statistic, points sum the total goals and assists scored by a player. As a team statistic, points are awarded to a team to assess standings or rankings.
The following are statistics commonly tracked in ice hockey.
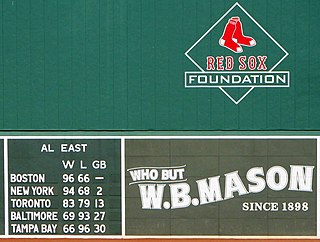
In most North American sports, the phrase games behind or games back is a common way to reflect the gap between a leading team and another team in a sports league, conference, or division.
In games and sports, a tiebreaker or tiebreak is used to determine a winner from among players or teams when their scores are tied at the end of a contest, or a set of contests.
The season structure of the National Hockey League (NHL) is divided into the pre-season, regular season, and the Stanley Cup playoffs. In the pre-season, which is generally held during the last two weeks of September, each team plays several not-for-the-record exhibition games. In the regular season, which generally runs from early October through early April, teams play 82 games which determine their standings. The three highest-placed teams in each division and two wild card teams per conference enter the playoff elimination tournament to determine the Stanley Cup champion.
Three points for a win is a standard used in many sports leagues and group tournaments, especially in association football, in which three points are awarded to the team winning a match, with no points awarded to the losing team. If the game is drawn, each team receives one point. Many leagues and competitions originally awarded two points for a win and one point for a draw, before switching to the three points for a win system. The change is significant in league tables, where teams typically play 30–40 games per season. The system places additional value on wins compared to draws such that teams with a higher number of wins may rank higher in tables than teams with a lower number of wins but more draws.
In a group tournament, unlike a knockout tournament, there is no scheduled decisive final match. Instead, all the competitors are ranked by examining the results of all the matches played in the tournament. Typically, points are awarded for each match, with competitors ranked based either on total number of points or average points per match.
In statistics, the Kendall rank correlation coefficient, commonly referred to as Kendall's τ coefficient, is a statistic used to measure the ordinal association between two measured quantities. A τ test is a non-parametric hypothesis test for statistical dependence based on the τ coefficient. It is a measure of rank correlation: the similarity of the orderings of the data when ranked by each of the quantities. It is named after Maurice Kendall, who developed it in 1938, though Gustav Fechner had proposed a similar measure in the context of time series in 1897.
A replay is the repetition of a match in many sports.
The 1926–27 Chicago Black Hawks season was the team's first season. Chicago was awarded an NHL franchise. Most of the team's players came from the Portland Rosebuds of the Western Canada Hockey League, which had folded the previous season. The team would qualify for the playoffs in their first season, but lost in a 2-game total goal series.
The 1976–77 Montreal Canadiens season was the Canadiens' 68th season. The team is regarded to be the greatest NHL team ever composed. The Canadiens won their 20th Stanley Cup in 1976–77, taking the NHL championship. Montreal set new records for most wins (60) and points (132) in a season. Those records were not broken until the re-introduction of regular season overtime and the extension of the schedule to 82 games. The 1976–77 Canadiens continue to hold the all-time records for regulation wins as well as points per game (1.650). They outscored their opponents by 216 goals, a differential average of 2.7 goals per game.
The marathon standings for the Swedish Hockey League (SHL) (formerly named Elitserien) is an accumulated table for the Swedish Hockey League, the current top Swedish ice hockey league, since it was inaugurated in the 1975–76 season. The marathon standings, updated by the Swedish Ice Hockey Association (SIHA), presents an overview of the overall regular-season records for all teams who have played at least one season in the SHL. The table is sorted after the highest number of total points.

The 2018–19 NCAA Division I men's ice hockey season began in October 2018 and ended with the Frozen Four in April 2019. This was the 72nd season in which an NCAA ice hockey championship was held, and United States college ice hockey's 125th year overall.
The 2022–23 Champions Hockey League was the eighth season of the Champions Hockey League, a European ice hockey tournament. The tournament is competed by 32 teams, with qualification being on sporting merits only. The six founding leagues will be represented by between three and five teams, while seven "challenge leagues" will be to be represented by one team each.


