Related Research Articles
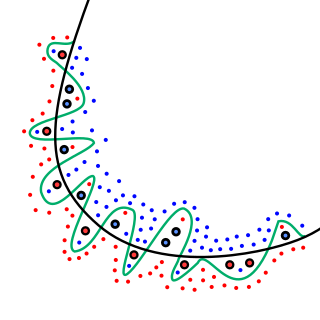
In mathematical modeling, overfitting is "the production of an analysis that corresponds too closely or exactly to a particular set of data, and may therefore fail to fit to additional data or predict future observations reliably". An overfitted model is a mathematical model that contains more parameters than can be justified by the data. In a mathematical sense, these parameters represent the degree of a polynomial. The essence of overfitting is to have unknowingly extracted some of the residual variation as if that variation represented underlying model structure.

Protein structure prediction is the inference of the three-dimensional structure of a protein from its amino acid sequence—that is, the prediction of its secondary and tertiary structure from primary structure. Structure prediction is different from the inverse problem of protein design. Protein structure prediction is one of the most important goals pursued by computational biology; it is important in medicine and biotechnology.

In mathematics, a time series is a series of data points indexed in time order. Most commonly, a time series is a sequence taken at successive equally spaced points in time. Thus it is a sequence of discrete-time data. Examples of time series are heights of ocean tides, counts of sunspots, and the daily closing value of the Dow Jones Industrial Average.

Cross-validation, sometimes called rotation estimation or out-of-sample testing, is any of various similar model validation techniques for assessing how the results of a statistical analysis will generalize to an independent data set. Cross-validation includes resampling and sample splitting methods that use different portions of the data to test and train a model on different iterations. It is often used in settings where the goal is prediction, and one wants to estimate how accurately a predictive model will perform in practice. It can also be used to assess the quality of a fitted model and the stability of its parameters.
The curse of dimensionality refers to various phenomena that arise when analyzing and organizing data in high-dimensional spaces that do not occur in low-dimensional settings such as the three-dimensional physical space of everyday experience. The expression was coined by Richard E. Bellman when considering problems in dynamic programming. The curse generally refers to issues that arise when the number of datapoints is small relative to the intrinsic dimension of the data.
Quantitative structure–activity relationship models are regression or classification models used in the chemical and biological sciences and engineering. Like other regression models, QSAR regression models relate a set of "predictor" variables (X) to the potency of the response variable (Y), while classification QSAR models relate the predictor variables to a categorical value of the response variable.

In statistical modeling, regression analysis is a set of statistical processes for estimating the relationships between a dependent variable and one or more independent variables. The most common form of regression analysis is linear regression, in which one finds the line that most closely fits the data according to a specific mathematical criterion. For example, the method of ordinary least squares computes the unique line that minimizes the sum of squared differences between the true data and that line. For specific mathematical reasons, this allows the researcher to estimate the conditional expectation of the dependent variable when the independent variables take on a given set of values. Less common forms of regression use slightly different procedures to estimate alternative location parameters or estimate the conditional expectation across a broader collection of non-linear models.
Bootstrap aggregating, also called bagging, is a machine learning ensemble meta-algorithm designed to improve the stability and accuracy of machine learning algorithms used in statistical classification and regression. It also reduces variance and helps to avoid overfitting. Although it is usually applied to decision tree methods, it can be used with any type of method. Bagging is a special case of the model averaging approach.
Random forests or random decision forests is an ensemble learning method for classification, regression and other tasks that operates by constructing a multitude of decision trees at training time. For classification tasks, the output of the random forest is the class selected by most trees. For regression tasks, the mean or average prediction of the individual trees is returned. Random decision forests correct for decision trees' habit of overfitting to their training set.

Linear discriminant analysis (LDA), normal discriminant analysis (NDA), or discriminant function analysis is a generalization of Fisher's linear discriminant, a method used in statistics and other fields, to find a linear combination of features that characterizes or separates two or more classes of objects or events. The resulting combination may be used as a linear classifier, or, more commonly, for dimensionality reduction before later classification.
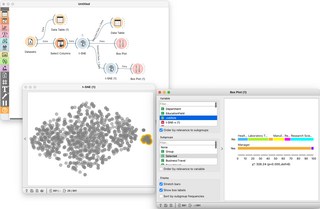
Orange is an open-source data visualization, machine learning and data mining toolkit. It features a visual programming front-end for explorative qualitative data analysis and interactive data visualization.
In statistics, a generalized additive model (GAM) is a generalized linear model in which the linear response variable depends linearly on unknown smooth functions of some predictor variables, and interest focuses on inference about these smooth functions.
Predictive analytics is a form of business analytics applying machine learning to generate a predictive model for certain business applications. As such, it encompasses a variety of statistical techniques from predictive modeling and machine learning that analyze current and historical facts to make predictions about future or otherwise unknown events. It represents a major subset of machine learning applications; in some contexts, it is synonymous with machine learning.
In statistics, regression validation is the process of deciding whether the numerical results quantifying hypothesized relationships between variables, obtained from regression analysis, are acceptable as descriptions of the data. The validation process can involve analyzing the goodness of fit of the regression, analyzing whether the regression residuals are random, and checking whether the model's predictive performance deteriorates substantially when applied to data that were not used in model estimation.
In statistics and machine learning, ensemble methods use multiple learning algorithms to obtain better predictive performance than could be obtained from any of the constituent learning algorithms alone. Unlike a statistical ensemble in statistical mechanics, which is usually infinite, a machine learning ensemble consists of only a concrete finite set of alternative models, but typically allows for much more flexible structure to exist among those alternatives.
The following outline is provided as an overview of and topical guide to regression analysis:

In machine learning, feature learning or representation learning is a set of techniques that allows a system to automatically discover the representations needed for feature detection or classification from raw data. This replaces manual feature engineering and allows a machine to both learn the features and use them to perform a specific task.
In statistics, linear regression is a statistical model which estimates the linear relationship between a scalar response and one or more explanatory variables. The case of one explanatory variable is called simple linear regression; for more than one, the process is called multiple linear regression. This term is distinct from multivariate linear regression, where multiple correlated dependent variables are predicted, rather than a single scalar variable. If the explanatory variables are measured with error then errors-in-variables models are required, also known as measurement error models.
In network theory, collective classification is the simultaneous prediction of the labels for multiple objects, where each label is predicted using information about the object's observed features, the observed features and labels of its neighbors, and the unobserved labels of its neighbors. Collective classification problems are defined in terms of networks of random variables, where the network structure determines the relationship between the random variables. Inference is performed on multiple random variables simultaneously, typically by propagating information between nodes in the network to perform approximate inference. Approaches that use collective classification can make use of relational information when performing inference. Examples of collective classification include predicting attributes of individuals in a social network, classifying webpages in the World Wide Web, and inferring the research area of a paper in a scientific publication dataset.
References
- 1 2 3 4 Rodriguez, Jesus. "Edge 255: Interpretability Methods: Accumulated Local Effects (ALE)". thesequence.substack.com. Retrieved 2022-12-27.
- 1 2 3 "Accumulated Local Effects — ADS 2.7.0 documentation". docs.oracle.com. Retrieved 2022-12-31.
- 1 2 Gupta, Aman (2020-10-25). "Accumulated Local Effects (ALE)-Feature Importance Technique". Analytics Vidhya. Retrieved 2022-12-27.