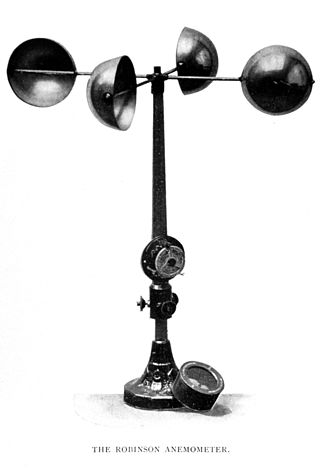
In meteorology, an anemometer is a device that measures wind speed and direction. It is a common instrument used in weather stations. The earliest known description of an anemometer was by Italian architect and author Leon Battista Alberti (1404–1472) in 1450.
Atmospheric pressure, also known as air pressure or barometric pressure, is the pressure within the atmosphere of Earth. The standard atmosphere is a unit of pressure defined as 101,325 Pa (1,013.25 hPa), which is equivalent to 1,013.25 millibars, 760 mm Hg, 29.9212 inches Hg, or 14.696 psi. The atm unit is roughly equivalent to the mean sea-level atmospheric pressure on Earth; that is, the Earth's atmospheric pressure at sea level is approximately 1 atm.

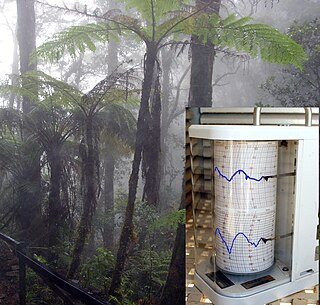
A barometer is a scientific instrument that is used to measure air pressure in a certain environment. Pressure tendency can forecast short term changes in the weather. Many measurements of air pressure are used within surface weather analysis to help find surface troughs, pressure systems and frontal boundaries.

Humidity is the concentration of water vapor present in the air. Water vapor, the gaseous state of water, is generally invisible to the human eye. Humidity indicates the likelihood for precipitation, dew, or fog to be present.

The pascal is the unit of pressure in the International System of Units (SI). It is also used to quantify internal pressure, stress, Young's modulus, and ultimate tensile strength. The unit, named after Blaise Pascal, is an SI coherent derived unit defined as one newton per square metre (N/m2). It is also equivalent to 10 barye in the CGS system. Common multiple units of the pascal are the hectopascal, which is equal to one millibar, and the kilopascal, which is equal to one centibar.
Surface weather analysis is a special type of weather map that provides a view of weather elements over a geographical area at a specified time based on information from ground-based weather stations.

The bar is a metric unit of pressure defined as 100,000 Pa (100 kPa), though not part of the International System of Units (SI). A pressure of 1 bar is slightly less than the current average atmospheric pressure on Earth at sea level. By the barometric formula, 1 bar is roughly the atmospheric pressure on Earth at an altitude of 111 metres at 15 °C.
A weather map, also known as synoptic weather chart, displays various meteorological features across a particular area at a particular point in time and has various symbols which all have specific meanings. Such maps have been in use since the mid-19th century and are used for research and weather forecasting purposes. Maps using isotherms show temperature gradients, which can help locate weather fronts. Isotach maps, analyzing lines of equal wind speed, on a constant pressure surface of 300 or 250 hPa show where the jet stream is located. Use of constant pressure charts at the 700 and 500 hPa level can indicate tropical cyclone motion. Two-dimensional streamlines based on wind speeds at various levels show areas of convergence and divergence in the wind field, which are helpful in determining the location of features within the wind pattern. A popular type of surface weather map is the surface weather analysis, which plots isobars to depict areas of high pressure and low pressure. Cloud codes are translated into symbols and plotted on these maps along with other meteorological data that are included in synoptic reports sent by professionally trained observers.

In meteorology, the synoptic scale is a horizontal length scale of the order of 1,000 km (620 mi) or more. This corresponds to a horizontal scale typical of mid-latitude depressions. Most high- and low-pressure areas seen on weather maps are synoptic-scale systems, driven by the location of Rossby waves in their respective hemisphere. Low-pressure areas and their related frontal zones occur on the leading edge of a trough within the Rossby wave pattern, while high-pressure areas form on the back edge of the trough. Most precipitation areas occur near frontal zones. The word synoptic is derived from the Ancient Greek word συνοπτικός (sunoptikós), meaning "seen together".

A contour line of a function of two variables is a curve along which the function has a constant value, so that the curve joins points of equal value. It is a plane section of the three-dimensional graph of the function parallel to the -plane. More generally, a contour line for a function of two variables is a curve connecting points where the function has the same particular value.
Psychrometrics is the field of engineering concerned with the physical and thermodynamic properties of gas-vapor mixtures.
A pressure system is a peak or lull in the sea level pressure distribution, a feature of synoptic-scale weather. The surface pressure at sea level varies minimally, with the lowest value measured 87 kilopascals (26 inHg) and the highest recorded 108.57 kilopascals (32.06 inHg). High- and low-pressure systems evolve due to interactions of temperature differentials in the atmosphere, temperature differences between the atmosphere and water within oceans and lakes, the influence of upper-level disturbances, as well as the amount of solar heating or radiationized cooling an area receives. Pressure systems cause weather to be experienced locally. Low-pressure systems are associated with clouds and precipitation that minimize temperature changes throughout the day, whereas high-pressure systems normally associate with dry weather and mostly clear skies with larger diurnal temperature changes due to greater radiation at night and greater sunshine during the day. Pressure systems are analyzed by those in the field of meteorology within surface weather maps.

A weather front is a boundary separating air masses for which several characteristics differ, such as air density, wind, temperature, and humidity. Disturbed and unstable weather due to these differences often arises along the boundary. For instance, cold fronts can bring bands of thunderstorms and cumulonimbus precipitation or be preceded by squall lines, while warm fronts are usually preceded by stratiform precipitation and fog. In summer, subtler humidity gradients known as dry lines can trigger severe weather. Some fronts produce no precipitation and little cloudiness, although there is invariably a wind shift.
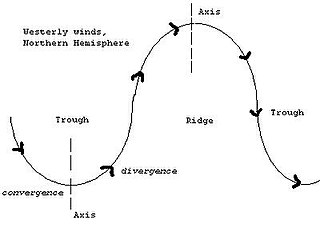
A trough is an elongated region of relatively low atmospheric pressure without a closed isobaric contour that would define it as a low pressure area. Since low pressure implies a low height on a pressure surface, troughs and ridges refer to features in an identical sense as those on a topographic map.
Mesoscale meteorology is the study of weather systems and processes at horizontal scales of approximately 5 kilometres (3 mi) to several hundred kilometres. It is smaller than synoptic-scale systems but larger than microscale. At the small end, it includes storm-scale phenomena. Examples of mesoscale weather systems are sea breezes, squall lines, and mesoscale convective complexes.

In meteorology, station models are symbolic illustrations showing the weather occurring at a given reporting station. Meteorologists created the station model to fit a number of weather elements into a small space on weather maps. This allows map users to analyze patterns in atmospheric pressure, temperature, wind speed and direction, cloud cover, precipitation, and other parameters. The most common station plots depict surface weather observations although upper air plots at various mandatory levels are also frequently depicted.

The following outline is provided as an overview of and topical guide to the field of Meteorology.

Surface weather observations are the fundamental data used for safety as well as climatological reasons to forecast weather and issue warnings worldwide. They can be taken manually, by a weather observer, by computer through the use of automated weather stations, or in a hybrid scheme using weather observers to augment the otherwise automated weather station. The ICAO defines the International Standard Atmosphere (ISA), which is the model of the standard variation of pressure, temperature, density, and viscosity with altitude in the Earth's atmosphere, and is used to reduce a station pressure to sea level pressure. Airport observations can be transmitted worldwide through the use of the METAR observing code. Personal weather stations taking automated observations can transmit their data to the United States mesonet through the Citizen Weather Observer Program (CWOP), the UK Met Office through their Weather Observations Website (WOW), or internationally through the Weather Underground Internet site. A thirty-year average of a location's weather observations is traditionally used to determine the station's climate. In the US a network of Cooperative Observers make a daily record of summary weather and sometimes water level information.

OpenSeaMap is a software project collecting freely usable nautical information and geospatial data to create a worldwide nautical chart. This chart is available on the OpenSeaMap website, and can also be downloaded for use as an electronic chart for offline applications.

The metresea water (msw) is a metric unit of pressure used in underwater diving. It is defined as one tenth of a bar.