In physics, attenuation is the gradual loss of flux intensity through a medium. For instance, dark glasses attenuate sunlight, lead attenuates X-rays, and water and air attenuate both light and sound at variable attenuation rates.
Noise figure (NF) and noise factor (F) are figures of merit that indicate degradation of the signal-to-noise ratio (SNR) that is caused by components in a signal chain. These figures of merit are used to evaluate the performance of an amplifier or a radio receiver, with lower values indicating better performance.
The propagation constant of a sinusoidal electromagnetic wave is a measure of the change undergone by the amplitude and phase of the wave as it propagates in a given direction. The quantity being measured can be the voltage, the current in a circuit, or a field vector such as electric field strength or flux density. The propagation constant itself measures the dimensionless change in magnitude or phase per unit length. In the context of two-port networks and their cascades, propagation constant measures the change undergone by the source quantity as it propagates from one port to the next.

In physics, a standing wave, also known as a stationary wave, is a wave that oscillates in time but whose peak amplitude profile does not move in space. The peak amplitude of the wave oscillations at any point in space is constant with respect to time, and the oscillations at different points throughout the wave are in phase. The locations at which the absolute value of the amplitude is minimum are called nodes, and the locations where the absolute value of the amplitude is maximum are called antinodes.
The total harmonic distortion is a measurement of the harmonic distortion present in a signal and is defined as the ratio of the sum of the powers of all harmonic components to the power of the fundamental frequency. Distortion factor, a closely related term, is sometimes used as a synonym.
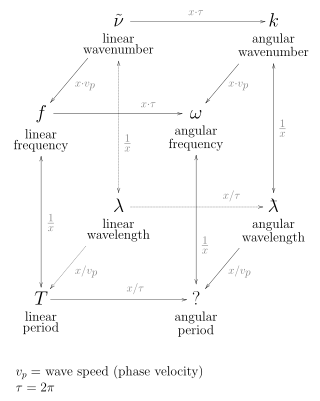
In the physical sciences, the wavenumber, also known as repetency, is the spatial frequency of a wave, measured in cycles per unit distance or radians per unit distance. It is analogous to temporal frequency, which is defined as the number of wave cycles per unit time or radians per unit time.
In optics, a Fabry–Pérot interferometer (FPI) or etalon is an optical cavity made from two parallel reflecting surfaces. Optical waves can pass through the optical cavity only when they are in resonance with it. It is named after Charles Fabry and Alfred Perot, who developed the instrument in 1899. Etalon is from the French étalon, meaning "measuring gauge" or "standard".
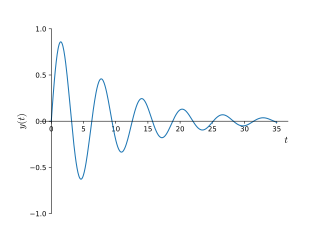
In physics and engineering, the quality factor or Q factor is a dimensionless parameter that describes how underdamped an oscillator or resonator is. It is defined as the ratio of the initial energy stored in the resonator to the energy lost in one radian of the cycle of oscillation. Q factor is alternatively defined as the ratio of a resonator's centre frequency to its bandwidth when subject to an oscillating driving force. These two definitions give numerically similar, but not identical, results. Higher Q indicates a lower rate of energy loss and the oscillations die out more slowly. A pendulum suspended from a high-quality bearing, oscillating in air, has a high Q, while a pendulum immersed in oil has a low one. Resonators with high quality factors have low damping, so that they ring or vibrate longer.

In geophysics and reflection seismology, amplitude versus offset (AVO) or amplitude variation with offset is the general term for referring to the dependency of the seismic attribute, amplitude, with the distance between the source and receiver. AVO analysis is a technique that geophysicists can execute on seismic data to determine a rock's fluid content, porosity, density or seismic velocity, shear wave information, fluid indicators.
Pulse compression is a signal processing technique commonly used by radar, sonar and echography to either increase the range resolution when pulse length is constrained or increase the signal to noise ratio when the peak power and the bandwidth of the transmitted signal are constrained. This is achieved by modulating the transmitted pulse and then correlating the received signal with the transmitted pulse.
In seismology, first-break picking is the detecting or picking the onset arrivals of refracted signals from all the signals received by receiver arrays and produced by a particular source signal generation. It is also called first arrival picking or first break detection. First-break picking can be done automatically, manually or as a combination of both. With the development of computer science and the size of seismic surveys, automatic picking is often preferred.

Seismic inversion involves the set of methods which seismologists use to infer properties through physical measurements. Surface-wave inversion is the method by which elastic properties, density, and thickness of layers in the subsurface are obtained through analysis of surface-wave dispersion. The entire inversion process requires the gathering of seismic data, the creation of dispersion curves, and finally the inference of subsurface properties.
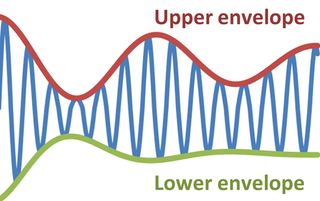
In physics and engineering, the envelope of an oscillating signal is a smooth curve outlining its extremes. The envelope thus generalizes the concept of a constant amplitude into an instantaneous amplitude. The figure illustrates a modulated sine wave varying between an upper envelope and a lower envelope. The envelope function may be a function of time, space, angle, or indeed of any variable.
Seismic inverse Q filtering is a data processing technology for enhancing the resolution of reflection seismology images. Q is the anelastic attenuation factor or the seismic quality factor, a measure of the energy loss as the seismic wave moves.
Dispersive body waves is an important aspect of seismic theory. When a wave propagates through subsurface materials both energy dissipation and velocity dispersion takes place. Energy dissipation is frequency dependent and causes decreased resolution of the seismic images when recorded in seismic prospecting. The attendant dispersion is a necessary consequence of the energy dissipation and causes the high frequency waves to travel faster than the low-frequency waves. The consequence for the seismic image is a frequency dependent time-shift of the data, and so correct timings for lithological identification cannot be obtained.
Stabilized inverse Q filtering is a data processing technology for enhancing the resolution of reflection seismology images where the stability of the method used is considered. Q is the anelastic attenuation factor or the seismic quality factor, a measure of the energy loss as the seismic wave moves. To obtain a solution when we make computations with a seismic model we always have to consider the problem of instability and try to obtain a stabilized solution for seismic inverse Q filtering.
Mathematical Q models provide a model of the earth's response to seismic waves. In reflection seismology, the anelastic attenuation factor, often expressed as seismic quality factor or Q, which is inversely proportional to attenuation factor, quantifies the effects of anelastic attenuation on the seismic wavelet caused by fluid movement and grain boundary friction. When a plane wave propagates through a homogeneous viscoelastic medium, the effects of amplitude attenuation and velocity dispersion may be combined conveniently into the single dimensionless parameter, Q. As a seismic wave propagates through a medium, the elastic energy associated with the wave is gradually absorbed by the medium, eventually ending up as heat energy. This is known as absorption and will eventually cause the total disappearance of the seismic wave.
A standard linear solid Q model (SLS) for attenuation and dispersion is one of many mathematical Q models that gives a definition of how the earth responds to seismic waves. When a plane wave propagates through a homogeneous viscoelastic medium, the effects of amplitude attenuation and velocity dispersion may be combined conveniently into a single dimensionless parameter, Q, the medium-quality factor.
Multidimension spectral estimation is a generalization of spectral estimation, normally formulated for one-dimensional signals, to multidimensional signals or multivariate data, such as wave vectors.
A seismic array is a system of linked seismometers arranged in a regular geometric pattern to increase sensitivity to earthquake and explosion detection. A seismic array differs from a local network of seismic stations mainly by the techniques used for data analysis. The data from a seismic array is obtained using special digital signal processing techniques such as beamforming, which suppress noises and thus enhance the signal-to-noise ratio (SNR).


