Complex analysis, traditionally known as the theory of functions of a complex variable, is the branch of mathematical analysis that investigates functions of complex numbers. It is useful in many branches of mathematics, including algebraic geometry, number theory, analytic combinatorics, applied mathematics; as well as in physics, including the branches of hydrodynamics, thermodynamics, and particularly quantum mechanics. By extension, use of complex analysis also has applications in engineering fields such as nuclear, aerospace, mechanical and electrical engineering.
A descriptive statistic is a summary statistic that quantitatively describes or summarizes features of a collection of information, while descriptive statistics in the mass noun sense is the process of using and analyzing those statistics. Descriptive statistics is distinguished from inferential statistics, in that descriptive statistics aims to summarize a sample, rather than use the data to learn about the population that the sample of data is thought to represent. This generally means that descriptive statistics, unlike inferential statistics, is not developed on the basis of probability theory, and are frequently nonparametric statistics. Even when a data analysis draws its main conclusions using inferential statistics, descriptive statistics are generally also presented. For example, in papers reporting on human subjects, typically a table is included giving the overall sample size, sample sizes in important subgroups, and demographic or clinical characteristics such as the average age, the proportion of subjects of each sex, the proportion of subjects with related comorbidities, etc.
Econometrics is the application of statistical methods to economic data in order to give empirical content to economic relationships. More precisely, it is "the quantitative analysis of actual economic phenomena based on the concurrent development of theory and observation, related by appropriate methods of inference". An introductory economics textbook describes econometrics as allowing economists "to sift through mountains of data to extract simple relationships". The first known use of the term "econometrics" was by Polish economist Paweł Ciompa in 1910. Jan Tinbergen is considered by many to be one of the founding fathers of econometrics. Ragnar Frisch is credited with coining the term in the sense in which it is used today.
Multivariate statistics is a subdivision of statistics encompassing the simultaneous observation and analysis of more than one outcome variable. The application of multivariate statistics is multivariate analysis.

In statistics, dependence or association is any statistical relationship, whether causal or not, between two random variables or bivariate data. In the broadest sense correlation is any statistical association, though it commonly refers to the degree to which a pair of variables are linearly related. Familiar examples of dependent phenomena include the correlation between the physical statures of parents and their offspring, and the correlation between the demand for a limited supply product and its price.
In statistics, a spurious relationship or spurious correlation is a mathematical relationship in which two or more events or variables are associated but not causally related, due to either coincidence or the presence of a certain third, unseen factor.
In statistics, multivariate analysis of variance (MANOVA) is a procedure for comparing multivariate sample means. As a multivariate procedure, it is used when there are two or more dependent variables, and is typically followed by significance tests involving individual dependent variables separately. It helps to answer:
- Do changes in the independent variable(s) have significant effects on the dependent variables?
- What are the relationships among the dependent variables?
- What are the relationships among the independent variables?

In statistical modeling, regression analysis is a set of statistical processes for estimating the relationships among variables. It includes many techniques for modeling and analyzing several variables, when the focus is on the relationship between a dependent variable and one or more independent variables. More specifically, regression analysis helps one understand how the typical value of the dependent variable changes when any one of the independent variables is varied, while the other independent variables are held fixed.
Mathematical statistics is the application of probability theory, a branch of mathematics, to statistics, as opposed to techniques for collecting statistical data. Specific mathematical techniques which are used for this include mathematical analysis, linear algebra, stochastic analysis, differential equations, and measure theory.
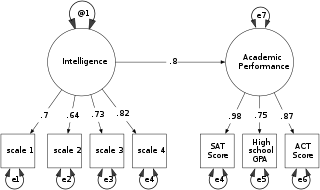
Structural equation modeling (SEM) is a form of causal modeling that includes a diverse set of mathematical models, computer algorithms, and statistical methods that fit networks of constructs to data. SEM includes confirmatory factor analysis, confirmatory composite analysis, path analysis, partial least squares path modeling, and latent growth modeling. The concept should not be confused with the related concept of structural models in econometrics, nor with structural models in economics. Structural equation models are often used to assess unobservable 'latent' constructs. They often invoke a measurement model that defines latent variables using one or more observed variables, and a structural model that imputes relationships between latent variables. The links between constructs of a structural equation model may be estimated with independent regression equations or through more involved approaches such as those employed in LISREL.

Data analysis is a process of inspecting, cleansing, transforming, and modeling data with the goal of discovering useful information, informing conclusions, and supporting decision-making. Data analysis has multiple facets and approaches, encompassing diverse techniques under a variety of names, and is used in different business, science, and social science domains. In today's business world, data analysis plays a role in making decisions more scientific and helping businesses operate more effectively.
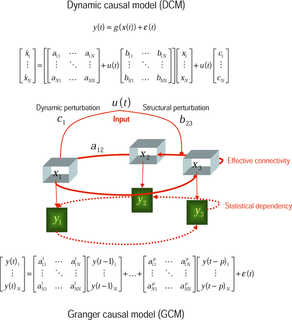
In philosophy of science, a causal model is a conceptual model that describes the causal mechanisms of a system. Causal models can improve study designs by providing clear rules for deciding which independent variables need to be included/controlled for.
In statistics, a mediation model is one that seeks to identify and explain the mechanism or process that underlies an observed relationship between an independent variable and a dependent variable via the inclusion of a third hypothetical variable, known as a mediator variable. Rather than a direct causal relationship between the independent variable and the dependent variable, a mediation model proposes that the independent variable influences the (non-observable) mediator variable, which in turn influences the dependent variable. Thus, the mediator variable serves to clarify the nature of the relationship between the independent and dependent variables.
In statistics, regression validation is the process of deciding whether the numerical results quantifying hypothesized relationships between variables, obtained from regression analysis, are acceptable as descriptions of the data. The validation process can involve analyzing the goodness of fit of the regression, analyzing whether the regression residuals are random, and checking whether the model's predictive performance deteriorates substantially when applied to data that were not used in model estimation.

A plot is a graphical technique for representing a data set, usually as a graph showing the relationship between two or more variables. The plot can be drawn by hand or by a mechanical or electronic plotter. Graphs are a visual representation of the relationship between variables, which are very useful for humans who can then quickly derive an understanding which may not have come from lists of values. Graphs can also be used to read off the value of an unknown variable plotted as a function of a known one. Graphs of functions are used in mathematics, sciences, engineering, technology, finance, and other areas.
A correlation coefficient is a numerical measure of some type of correlation, meaning a statistical relationship between two variables. The variables may be two columns of a given data set of observations, often called a sample, or two components of a multivariate random variable with a known distribution.
Bivariate analysis is one of the simplest forms of quantitative (statistical) analysis. It involves the analysis of two variables, for the purpose of determining the empirical relationship between them.
In statistics, linear regression is a linear approach to modeling the relationship between a scalar response and one or more explanatory variables. The case of one explanatory variable is called simple linear regression. For more than one explanatory variable, the process is called multiple linear regression. This term is distinct from multivariate linear regression, where multiple correlated dependent variables are predicted, rather than a single scalar variable.