Antrim | |
---|---|
Antrim and Newtownabbey Borough Council DEA constituency | |
Current constituency | |
Created | 1985 |
Seats | 7 (1985-2014) 6 (2014-) |
Councillors |
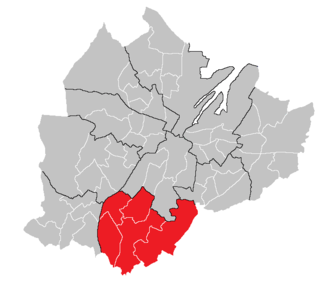
Antrim is one of the seven district electoral areas (DEA) in Antrim and Newtownabbey, Northern Ireland. [1] The district elects six members to Antrim and Newtownabbey Borough Council and contains the wards of Antrim Centre, Fountain Hill, Greystone, Springfarm, Steeple and Stiles. [2] Antrim forms part of the South Antrim constituencies for the Northern Ireland Assembly and UK Parliament.
It was created for the 1985 local elections, replacing Antrim Area C which had existed since 1973. It was called Antrim Town until 2014, and originally contained seven wards (Balloo, Fountain Hill, Massereene, Rathenraw, Springfarm, Steeple and Stiles). For the 2014 local elections it was reduced by one ward, losing Massereene and Rathenraw but gaining Antrim Centre.
Election | Councillor (Party) | Councillor (Party) | Councillor (Party) | Councillor (Party) | Councillor (Party) | Councillor (Party) | Councillor (Party) | |||||||
---|---|---|---|---|---|---|---|---|---|---|---|---|---|---|
2023 | Neil Kelly (Alliance) | Roisin Lynch (SDLP) | Lucille O'Hagan (Sinn Féin) | Leah Smyth (UUP) | Paul Dunlop (DUP) | John Smyth (DUP) | 6 seats 2014–present | |||||||
2019 | Jim Montgomery (UUP) | |||||||||||||
October 2018 Co-Option | Andrew Ritchie (UUP) | |||||||||||||
July 2015 Co-Option | Nigel Kells (DUP) | |||||||||||||
2014 | Adrian Cochrane-Watson (UUP) | |||||||||||||
2011 | Gráinne Teggart (SDLP) | Pam Lewis (DUP) | Brian Graham (DUP) | Noel Maguire (Sinn Féin) | ||||||||||
2005 | David Ford (Alliance) | Oran Keenan (SDLP) | John Smyth (DUP) | |||||||||||
2001 | Sean McKee (SDLP) | Paddy Marks (UUP) | Paul Michael (UUP) | |||||||||||
1997 | James McConnell (Alliance) | Andrew Thompson (UUP) | Andrew Ritchie (UUP) | Robert McClay (DUP) | ||||||||||
1993 | Jack Allen (UUP) | James Brown (DUP) | ||||||||||||
1989 | Avril Swann (UUP) | |||||||||||||
1985 | Roy Stinson (UUP) | Margaret Brown (DUP) | Charles Quinn (DUP) | |||||||||||
2019: 2 x DUP, 2 x UUP, 1 x Alliance, 1 x SDLP
2023: 2 x DUP, 1 x Sinn Féin, 1 x Alliance, 1 x UUP, 1 x SDLP
2019–2023 Change: Sinn Féin gain from UUP
Party | Candidate | FPv% | Count | ||||||||
---|---|---|---|---|---|---|---|---|---|---|---|
1 | 2 | 3 | 4 | 5 | 6 | 7 | 8 | ||||
Sinn Féin | Lucille O'Hagan | 17.82% | 1,270 | ||||||||
Alliance | Neil Kelly* | 15.31% | 1,091 | ||||||||
DUP | Paul Dunlop* | 13.84% | 986 | 987.05 | 1,078.05 | ||||||
DUP | John Smyth* | 10.12% | 721 | 722.26 | 857.26 | 858.46 | 905.36 | 1,168.36 | |||
SDLP | Roisin Lynch* | 9.51% | 678 | 851.67 | 888.34 | 902.68 | 903.35 | 913.35 | 914.71 | 1,104.71 | |
UUP | Leah Smyth* | 10.44% | 744 | 746.1 | 764.31 | 768.15 | 770.16 | 867.16 | 963.04 | 1,032.04 | |
UUP | Jim Montgomery* | 6.20% | 442 | 443.47 | 461.47 | 463.81 | 470.51 | 527.72 | 576 | 610 | |
Alliance | Tommy Monahan | 5.56% | 396 | 443.04 | 482.77 | 524.59 | 524.59 | 536.07 | 538.79 | ||
TUV | Richard Shields | 6.36% | 453 | 454.05 | 465.05 | 465.47 | 467.48 | ||||
DUP | Karl McMeekin | 3.61% | 257 | 257.21 | |||||||
Green (NI) | Eleanor Bailey | 1.23% | 88 | 101.23 | |||||||
Electorate: 16,652 Valid: 7,126 (42.79%) Spoilt: 89 Quota: 1,019 Turnout: 7,215 (43.33%) |
2014: 2 x DUP, 2 x UUP, 1 x Alliance, 1 x SDLP
2019: 2 x DUP, 2 x UUP, 1 x Alliance, 1 x SDLP
2014-2019 Change: No change
Party | Candidate | FPv% | Count | |||||||
---|---|---|---|---|---|---|---|---|---|---|
1 | 2 | 3 | 4 | 5 | 6 | 7 | ||||
Alliance | Neil Kelly* | 26.26% | 1,689 | |||||||
SDLP | Roisin Lynch* | 11.24% | 723 | 1,111.11 | ||||||
DUP | John Smyth* | 11.41% | 734 | 765.11 | 769.79 | 832.32 | 1,047.32 | |||
DUP | Paul Dunlop | 9.38% | 603 | 620.34 | 622.14 | 704.69 | 806.77 | 921.45 | ||
UUP | Leah Smyth | 9.56% | 615 | 721.08 | 752.04 | 802.07 | 838.17 | 844.27 | 971.27 | |
UUP | Jim Montgomery | 6.47% | 416 | 477.2 | 503.48 | 557.05 | 578.68 | 581.73 | 824.65 | |
Sinn Féin | Gerard Magee | 9.06% | 583 | 637.06 | 725.98 | 727.98 | 728.34 | 728.34 | 740.89 | |
Independent | Adrian Cochrane-Watson | 5.58% | 359 | 421.73 | 449.09 | 527.29 | 538.82 | 541.26 | ||
DUP | Karl McMeekin | 5.64% | 363 | 379.83 | 382.35 | 403.35 | ||||
TUV | Richard Cairns | 5.40% | 347 | 374.54 | 379.58 | |||||
Electorate: 15,051 Valid: 6,432 (42.73%) Spoilt: 80 Quota: 919 Turnout: 6,512 (43.27%) |
2011: 2 x DUP, 2 x UUP, 1 x Alliance, 1 x Sinn Féin, 1 x SDLP
2014: 2 x DUP, 2 x UUP, 1 x Alliance, 1 x SDLP
2011-2014 Change: Sinn Féin loss due to the reduction of one seat
Party | Candidate | FPv% | Count | ||||||
---|---|---|---|---|---|---|---|---|---|
1 | 2 | 3 | 4 | 5 | 6 | ||||
DUP | Nigel Kells † | 11.15% | 662 | 667 | 1,026 | ||||
UUP | Adrian Cochrane-Watson * † | 13.22% | 785 | 801 | 844 | 858.21 | |||
DUP | John Smyth* | 10.62% | 631 | 636 | 724 | 856.79 | |||
UUP | Drew Ritchie* | 9.63% | 572 | 595 | 614 | 626.25 | 1,009.25 | ||
Alliance | Neil Kelly* | 10.44% | 620 | 813 | 825 | 830.39 | 876.39 | ||
SDLP | Roisin Lynch | 10.24% | 608 | 636 | 637 | 638.47 | 648.94 | 690.94 | |
Sinn Féin | Noel Maguire* | 10.64% | 632 | 643 | 644 | 644 | 646.98 | 646.98 | |
TUV | Richard Cairns | 9.43% | 560 | 574 | 591 | 598.84 | |||
DUP | Brian Graham* | 9.09% | 540 | 545 | |||||
Alliance | Sian O'Neill | 3.06% | 182 | ||||||
NI21 | George Young | 2.42% | 144 | ||||||
Electorate: 14,408 Valid: 5,939 (41.22%) Spoilt: 101 Quota: 849 Turnout: 6,040 (41.92%) |
2005: 3 x DUP, 2 x UUP, 1 x Alliance, 1 x SDLP
2011: 2 x DUP, 2 x UUP, 1 x Alliance, 1 x Sinn Féin, 1 x SDLP
2005-2011 Change: Sinn Féin gain from DUP
Party | Candidate | FPv% | Count | ||||||||
---|---|---|---|---|---|---|---|---|---|---|---|
1 | 2 | 3 | 4 | 5 | 6 | 7 | 8 | ||||
UUP | Adrian Cochrane-Watson * | 17.25% | 884 | ||||||||
DUP | Pam Lewis * | 14.32% | 734 | ||||||||
Sinn Féin | Noel Maguire | 12.45% | 638 | 638.56 | 638.56 | 639.56 | 655.56 | ||||
UUP | Andrew Ritchie* | 7.80% | 400 | 490.72 | 496.44 | 521.51 | 654.87 | ||||
Alliance | Neil Kelly | 9.77% | 501 | 509.4 | 512.65 | 517.65 | 546.18 | 847.18 | |||
DUP | Brian Graham* | 9.97% | 511 | 536.48 | 585.1 | 602.2 | 618.62 | 622.9 | 651.9 | ||
SDLP | Gráinne Teggart | 7.22% | 370 | 371.4 | 372.44 | 372.44 | 418.85 | 455.53 | 580.53 | 591.53 | |
DUP | John Smyth* | 8.56% | 439 | 459.16 | 486.59 | 523.38 | 530.54 | 536.62 | 561.62 | 562.62 | |
Alliance | Oran Keenan* | 6.89% | 353 | 356.92 | 357.57 | 360.57 | 381.53 | ||||
UUP | Amanda Johnston | 1.35% | 69 | 151.6 | 154.2 | 167.33 | |||||
Independent | Donovan McClelland | 2.30% | 118 | 119.4 | 120.18 | 121.18 | |||||
PUP | Ken Wilkinson | 2.13% | 109 | 113.48 | 115.04 | ||||||
Electorate: 11,925 Valid: 5,126 (42.99%) Spoilt: 102 Quota: 641 Turnout: 5,228 (43.84%) |
2001: 3 x UUP, 2 x DUP, 2 x SDLP
2005: 3 x DUP, 2 x UUP, 1 x SDLP, 1 x Alliance
2001-2005 Change: DUP and Alliance gain from UUP and SDLP
Party | Candidate | FPv% | Count | |||||||
---|---|---|---|---|---|---|---|---|---|---|
1 | 2 | 3 | 4 | 5 | 6 | 7 | ||||
DUP | John Smyth* | 13.33% | 705 | |||||||
UUP | Adrian Cochrane-Watson * | 12.65% | 669 | |||||||
SDLP | Oran Keenan* | 8.08% | 427 | 427.06 | 434.12 | 684.12 | ||||
Alliance | David Ford | 11.65% | 616 | 616.66 | 626.72 | 680.72 | ||||
UUP | Andrew Ritchie | 8.00% | 423 | 425.52 | 485.12 | 489.12 | 490.47 | 791.47 | ||
DUP | Brian Graham* | 8.80% | 465 | 484.86 | 537.28 | 538.28 | 538.58 | 579.36 | 658.41 | |
DUP | Pam Lewis | 9.06% | 479 | 493.94 | 539.3 | 543.3 | 544.05 | 574.89 | 626.04 | |
Sinn Féin | Gerard Magee | 8.98% | 475 | 475 | 490 | 518 | 534.65 | 539.1 | 539.1 | |
UUP | Paul Michael* | 7.02% | 371 | 372.8 | 439.1 | 441.1 | 444.1 | |||
SDLP | Brian Duffin | 6.53% | 345 | 345.06 | 356.06 | |||||
Independent | Darran Smyth | 2.57% | 136 | 136.9 | ||||||
PUP | Ken Wilkinson | 2.08% | 110 | 110.66 | ||||||
UUP | James Sands | 0.72% | 38 | 38.48 | ||||||
Independent | Aine Gribbon | 0.53% | 28 | 28 | ||||||
Electorate: 10,792 Valid: 5,287 (48.99%) Spoilt: 123 Quota: 661 Turnout: 5,410 (50.13%) |
1997: 4 x UUP, 1 x DUP, 1 x SDLP, 1 x Alliance
2001: 3 x UUP, 2 x DUP, 2 x SDLP
1997-2001 Change: DUP and SDLP gain from UUP and Alliance
Party | Candidate | FPv% | Count | |||||||||
---|---|---|---|---|---|---|---|---|---|---|---|---|
1 | 2 | 3 | 4 | 5 | 6 | 7 | 8 | 9 | ||||
UUP | Paddy Marks* | 15.98% | 1,016 | |||||||||
DUP | John Smyth | 11.78% | 749 | 759.56 | 799.56 | |||||||
UUP | Adrian Cochrane-Watson * | 9.94% | 632 | 695.14 | 721.36 | 812.36 | ||||||
DUP | Brian Graham | 8.12% | 516 | 521.28 | 532.28 | 542.7 | 543.58 | 847.58 | ||||
UUP | Paul Michael | 7.39% | 470 | 529.18 | 566.4 | 751.86 | 766.6 | 808.6 | ||||
SDLP | Sean McKee | 9.94% | 632 | 635.96 | 642.96 | 646.62 | 646.84 | 648.84 | 651.36 | 651.36 | 778.36 | |
SDLP | Oran Keenan* | 9.61% | 611 | 614.52 | 617.74 | 620.84 | 621.06 | 623.06 | 625.58 | 625.58 | 726.58 | |
Sinn Féin | Aine Gribbon | 7.79% | 495 | 495.44 | 500.44 | 500.44 | 500.66 | 501.66 | 501.66 | 501.66 | 517.66 | |
Alliance | Pete Whitcroft | 6.39% | 406 | 411.06 | 420.06 | 429.36 | 429.8 | 439.44 | 486.48 | 491.48 | ||
DUP | Robert McClay* | 5.76% | 366 | 373.26 | 391.7 | 408.12 | 408.56 | |||||
UUP | Andrew Ritchie* | 4.22% | 268 | 325.42 | 344.08 | |||||||
PUP | Ken Wilkinson | 3.10% | 197 | 199.42 | ||||||||
Electorate: 11,616 Valid: 6,358 (54.73%) Spoilt: 195 Quota: 795 Turnout: 6,553 (56.41%) |
1993: 4 x UUP, 1 x DUP, 1 x SDLP, 1 x Alliance
1997: 4 x UUP, 1 x DUP, 1 x SDLP, 1 x Alliance
1993-1997 Change: No change
Party | Candidate | FPv% | Count | |||||||||
---|---|---|---|---|---|---|---|---|---|---|---|---|
1 | 2 | 3 | 4 | 5 | 6 | 7 | 8 | 9 | ||||
UUP | Paddy Marks* | 25.51% | 1,066 | |||||||||
DUP | Robert McClay | 15.36% | 642 | |||||||||
UUP | Andrew Ritchie* | 6.87% | 287 | 646.04 | ||||||||
SDLP | Oran Keenan* | 12.30% | 514 | 516.04 | 516.04 | 516.24 | 520.75 | 531.75 | ||||
UUP | Andrew Thompson* | 5.22% | 218 | 314.39 | 410.95 | 479.55 | 495.72 | 504.18 | 562.18 | |||
UUP | Adrian Cochrane-Watson | 8.54% | 357 | 410.04 | 427.38 | 464.38 | 474.03 | 485.18 | 524.24 | |||
Alliance | James McConnell* | 6.41% | 268 | 279.73 | 281.09 | 282.69 | 292.4 | 412.2 | 458.8 | 467.8 | 470.71 | |
SDLP | Sean McKee | 10.36% | 433 | 436.06 | 436.23 | 436.43 | 437.43 | 446.43 | 458.43 | 460.43 | 466.25 | |
Independent | Maurice Lynn | 2.97% | 124 | 126.55 | 127.06 | 130.06 | 193.19 | 202.1 | ||||
Alliance | Mary Wallace | 3.80% | 159 | 167.16 | 169.03 | 170.63 | 178.05 | |||||
Independent | Samuel Greer | 2.66% | 111 | 115.59 | 116.44 | 121.24 | ||||||
Electorate: 11,780 Valid: 4,179 (35.48%) Spoilt: 92 Quota: 523 Turnout: 4,271 (36.26%) |
1989: 4 x UUP, 1 x DUP, 1 x SDLP, 1 x Alliance
1993: 4 x UUP, 1 x DUP, 1 x SDLP, 1 x Alliance
1989-1993 Change: No change
Party | Candidate | FPv% | Count | |||||||||
---|---|---|---|---|---|---|---|---|---|---|---|---|
1 | 2 | 3 | 4 | 5 | 6 | 7 | 8 | 9 | ||||
UUP | Paddy Marks* | 17.45% | 791 | |||||||||
UUP | Jack Allen* | 15.86% | 719 | |||||||||
SDLP | Oran Keenan* | 14.67% | 665 | |||||||||
DUP | James Brown* | 12.31% | 558 | 570.76 | ||||||||
UUP | Andrew Ritchie | 6.57% | 298 | 398.05 | 472.81 | 473.61 | 475.82 | 548.8 | 557.01 | 638.01 | ||
Alliance | James McConnell* | 8.80% | 399 | 405.38 | 413.15 | 448.03 | 473.51 | 476.01 | 525.08 | 531.08 | 532.08 | |
UUP | Andrew Thompson* | 5.56% | 252 | 291.73 | 312.52 | 312.68 | 312.68 | 341.6 | 343.76 | 461.13 | 516.13 | |
Alliance | Mary Wallace | 6.40% | 290 | 292.9 | 295.63 | 328.27 | 355.03 | 358.03 | 435.51 | 448.46 | 450.46 | |
UUP | Avril Swann* | 3.31% | 150 | 202.2 | 224.25 | 224.25 | 224.25 | 248.3 | 252.93 | |||
Democratic Left | Patrick McGinley | 3.95% | 179 | 180.16 | 181.42 | 192.14 | 217.62 | 219.83 | ||||
DUP | James Porter | 3.33% | 151 | 158.54 | 174.5 | 174.66 | 175.66 | |||||
Workers' Party | Eamon Gillen | 1.81% | 82 | 82 | 83.47 | 100.75 | ||||||
Electorate: 11,484 Valid: 4,534 (39.48%) Spoilt: 131 Quota: 567 Turnout: 4,665 (40.62%) |
1985: 3 x UUP, 2 x DUP, 1 x SDLP, 1 x Alliance
1989: 4 x UUP, 1 x DUP, 1 x SDLP, 1 x Alliance
1985-1989 Change: UUP gain from DUP
Party | Candidate | FPv% | Count | |||||||||
---|---|---|---|---|---|---|---|---|---|---|---|---|
1 | 2 | 3 | 4 | 5 | 6 | 7 | 8 | 9 | ||||
UUP | Jack Allen* | 21.11% | 907 | |||||||||
UUP | Paddy Marks* | 17.25% | 741 | |||||||||
DUP | James Brown | 14.06% | 604 | |||||||||
SDLP | Oran Keenan* | 12.52% | 535 | 537.46 | 538.58 | |||||||
Alliance | James McConnell* | 8.26% | 355 | 364.43 | 368.91 | 377.73 | 378.06 | 388.06 | 536.21 | 619.21 | ||
UUP | Avril Swann | 3.12% | 134 | 330.8 | 433.56 | 466.13 | 469.32 | 473.32 | 475.32 | 491.47 | 501.47 | |
UUP | Andrew Thompson | 5.68% | 244 | 324.77 | 386.65 | 396 | 398.64 | 398.64 | 399.64 | 402.05 | 405.05 | |
DUP | James Graham | 4.66% | 200 | 248.38 | 269.1 | 284.2 | 342.83 | 342.83 | 343.8 | 352.03 | 358.03 | |
Workers' Party | Eamon Gillen | 3.68% | 158 | 162.51 | 163.91 | 179.91 | 180.35 | 253.35 | 275.35 | |||
Alliance | Peter Kelly | 4.00% | 172 | 176.51 | 178.19 | 181.19 | 181.41 | 202.41 | ||||
Sinn Féin | Paul Little | 3.98% | 171 | 171 | 171.28 | 171.28 | 171.28 | |||||
Independent | James Millar | 1.75% | 75 | 89.76 | 97.04 | |||||||
Electorate: 9,883 Valid: 4,296 (43.47%) Spoilt: 141 Quota: 538 Turnout: 4,437 (44.90%) |
1985: 3 x UUP, 2 x DUP, 1 x SDLP, 1 x Alliance
Party | Candidate | FPv% | Count | ||||||||
---|---|---|---|---|---|---|---|---|---|---|---|
1 | 2 | 3 | 4 | 5 | 6 | 7 | 8 | ||||
UUP | Jack Allen* | 21.03% | 872 | ||||||||
SDLP | Oran Keenan | 16.16% | 670 | ||||||||
UUP | Paddy Marks* | 15.48% | 642 | ||||||||
Alliance | James McConnell | 6.42% | 266 | 273.79 | 324.79 | 326.31 | 352.31 | 399 | 405.28 | 577.28 | |
UUP | Roy Stinson | 2.41% | 100 | 289.01 | 289.01 | 333.85 | 337.79 | 340.98 | 498.4 | 516.46 | |
DUP | Margaret Brown | 10.44% | 433 | 469.9 | 470.15 | 478.89 | 478.89 | 480.71 | 505.24 | 510.88 | |
DUP | Charles Quinn* | 9.72% | 403 | 421.45 | 421.45 | 430.95 | 431.45 | 432.64 | 464.38 | 465.38 | |
DUP | Adam McKee | 6.75% | 280 | 295.17 | 295.67 | 304.22 | 305.97 | 308.97 | 337.5 | 346.05 | |
Alliance | Mary Wallace | 3.50% | 145 | 149.1 | 196.1 | 199.9 | 251.81 | 308.82 | 314.28 | ||
UUP | Andrew Thompson | 3.93% | 163 | 239.26 | 239.76 | 282.13 | 283.82 | 284.82 | |||
Alliance | James Williamson | 2.63% | 109 | 111.46 | 116.96 | 117.72 | 121.97 | ||||
Workers' Party | Robert Owens | 1.52% | 63 | 63.41 | 108.41 | 108.79 | |||||
Electorate: 9,755 Valid: 4,146 (42.50%) Spoilt: 138 Quota: 519 Turnout: 4,284 (43.92%) |
Balmoral is the most southern of ten district electoral areas (DEA) in Belfast, Northern Ireland. The district elects five members to Belfast City Council and contains the wards of Belvoir; Finaghy; Malone; Musgrave; Windsor; and Upper Malone. Balmoral, along with neighbouring Botanic, forms the greater part of the Belfast South constituencies for the Northern Ireland Assembly and UK Parliament.
Castle is one of the ten district electoral areas in Belfast, Northern Ireland. Located in the north of the city, the district elects six members to Belfast City Council and contains the wards of Bellevue, Cavehill, Chichester Park, Duncairn, Fortwilliam and Innisfayle. Castle, along with Oldpark district and parts of the Court district and Newtownabbey Borough Council, forms the Belfast North constituency for the Northern Ireland Assembly and UK Parliament. The district is bounded to the east by the Victoria Channel, to the north by Newtownabbey Borough Council and Belfast Lough, to the south by North Street and to the west by the Cavehill Road.
Elections to Antrim and Newtownabbey Borough Council, part of the Northern Ireland local elections on 2 May 2019, returned 40 members to the council using Single Transferable Vote. The Democratic Unionist Party were the largest party in both first-preference votes and seats.
Elections to Newtownabbey Borough Council were held on 5 May 2011 on the same day as the other Northern Irish local government elections. The election used four district electoral areas to elect a total of 25 councillors.
Elections to Antrim Borough Council were held on 5 May 2011 on the same day as the other Northern Irish local government elections. The election used three district electoral areas to elect a total of 19 councillors.
Elections to Antrim Borough Council were held on 17 May 1989 on the same day as the other Northern Irish local government elections. The election used three district electoral areas to elect a total of 19 councillors.
Killultagh is one of the seven district electoral areas (DEA) in Lisburn and Castlereagh, Northern Ireland. The district elects five members to Lisburn and Castlereagh City Council and contains the wards of Ballinderry, Glenavy, Maghaberry, Stonyford and White Mountain. Killultagh forms part of the Lagan Valley constituencies for the Northern Ireland Assembly and UK Parliament, and part of the South Antrim constituencies for the Northern Ireland Assembly and UK Parliament.
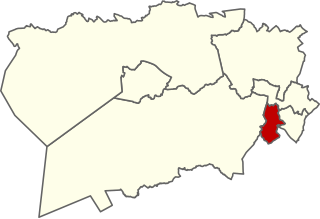
Glengormley Urban is one of the seven district electoral areas (DEA) in Antrim and Newtownabbey, Northern Ireland. The district elects seven members to Antrim and Newtownabbey Borough Council and contains the wards of Ballyhenry, Burnthill, Carnmoney, Collinbridge, Glebe, Glengormley and Hightown. Glengormley Urban forms part of the Belfast North constituencies for the Northern Ireland Assembly and UK Parliament and part of the South Antrim constituencies for the Northern Ireland Assembly and UK Parliament.
Antrim Line was one of the district electoral areas in Newtownabbey, Northern Ireland which existed from 1985 to 2014, one of five DEAs until 1993 and one of four DEAs until 2014. The district elected five members to Newtownabbey Borough Council until 1993 and seven members until 2014, and formed part of the South Antrim constituencies for the Northern Ireland Assembly and UK Parliament and part of the Belfast North constituencies for the Northern Ireland Assembly and UK Parliament.
Airport is one of the seven district electoral areas (DEA) in Antrim and Newtownabbey, Northern Ireland. The district elects five members to Antrim and Newtownabbey Borough Council and contains the wards of Aldergrove, Clady, Crumlin, Mallusk and Templepatrick. Airport forms part of the South Antrim constituencies for the Northern Ireland Assembly and UK Parliament.
Dunsilly is one of the seven district electoral areas (DEA) in Antrim and Newtownabbey, Northern Ireland. The district elects five members to Antrim and Newtownabbey Borough Council and contains the wards of Cranfield, Parkgate, Randalstown, Shilvodan and Toome. Airport forms part of the South Antrim constituencies for the Northern Ireland Assembly and UK Parliament.
Antrim South East was one of the three district electoral areas in Antrim, Northern Ireland which existed from 1985 to 2014. The district elected seven members to Antrim Borough Council and formed part of the South Antrim constituencies for the Northern Ireland Assembly and UK Parliament.
Antrim North West was one of the three district electoral areas in Antrim, Northern Ireland which existed from 1985 to 2014. The district elected five members to Antrim Borough Council and formed part of the South Antrim constituencies for the Northern Ireland Assembly and UK Parliament.
Coast Road is one of the seven district electoral areas (DEA) in Mid and East Antrim, Northern Ireland. The district elects five members to Mid and East Antrim District Council and contains the wards of Cairncastle, Carnlough and Glenarm, Craigyhill, Gardenmore and The Maidens. Coast Road forms part of the East Antrim constituencies for the Northern Ireland Assembly and UK Parliament.
Braid is one of the seven district electoral areas (DEA) in Mid and East Antrim, Northern Ireland. The district elects seven members to Mid and East Antrim District Council and contains the wards of Ballee and Harryville, Broughshane, Glenravel, Glenwhirry, Kells, Kirkinriola and Slemish. Braid forms part of the North Antrim constituencies for the Northern Ireland Assembly and UK Parliament.
Bann Valley was one of the three district electoral areas in Ballymoney, Northern Ireland which existed from 1985 to 2014. The district elected six members to Ballymoney Borough Council, and formed part of the North Antrim constituencies for the Northern Ireland Assembly and UK Parliament.
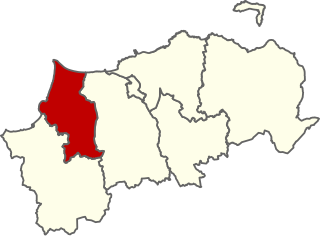
Limavady is one of the seven district electoral areas (DEA) in Causeway Coast and Glens, Northern Ireland. The district elects five members to Causeway Coast and Glens Borough Council and contains the wards of Coolessan, Drumsurn, Greystone, Magilligan and Roeside. Limavady forms part of the East Londonderry constituencies for the Northern Ireland Assembly and UK Parliament.
Banbridge is one of the seven district electoral areas (DEA) in Armagh City, Banbridge and Craigavon, Northern Ireland. The district elects seven members to Armagh City, Banbridge and Craigavon Borough Council and contains the wards of Banbridge East, Banbridge North, Banbridge South, Banbridge West, Gilford, Loughbrickland and Rathfriland. Banbridge forms part of the Upper Bann constituencies for the Northern Ireland Assembly and UK Parliament.
Lurgan is one of the seven district electoral areas (DEA) in Armagh City, Banbridge and Craigavon, Northern Ireland. The district elects seven members to Armagh City, Banbridge and Craigavon Borough Council and contains the wards of Aghagallon, Knocknashane, Lough Road, Magheralin, Mourneview, Parklake and Shankill. Lurgan forms part of the Upper Bann constituencies for the Northern Ireland Assembly and UK Parliament.
The Mournes is one of the seven district electoral areas (DEA) in Newry, Mourne and Down, Northern Ireland. The district elects seven members to Newry, Mourne and Down District Council and contains the wards of Annalong, Binnian, Donard, Kilkeel, Lisnacree, Murlough and Tollymore. The Mournes forms part of the South Down constituencies for the Northern Ireland Assembly and UK Parliament.