Related Research Articles
Environmental Systems Research Institute, Inc., doing business as Esri, is an American multinational geographic information system (GIS) software company headquartered in Redlands, California. It is best known for its ArcGIS products. With a 40% market share, Esri is the world's leading supplier of GIS software, web GIS and geodatabase management applications.
A GIS file format is a standard for encoding geographical information into a computer file, as a specialized type of file format for use in geographic information systems (GIS) and other geospatial applications. Since the 1970s, dozens of formats have been created based on various data models for various purposes. They have been created by government mapping agencies, GIS software vendors, standards bodies such as the Open Geospatial Consortium, informal user communities, and even individual developers.

ArcIMS is a Web Map Server produced by Esri accessible through a web browser. It is a GIS that is designed to serve maps across the Internet. Sometimes these maps are just static images allowing simple panning and zooming, while others are more complex pages. Examples of interactive maps served with ArcIMS include maps with layers that can be turned on and off, or with features containing attributes that can be queried.
A GIS software program is a computer program to support the use of a geographic information system, providing the ability to create, store, manage, query, analyze, and visualize geographic data, that is, data representing phenomena for which location is important. The GIS software industry encompasses a broad range of commercial and open-source products that provide some or all of these capabilities within various information technology architectures.

ArcView GIS was a geographic information system software product produced by ESRI. It was replaced by new product line, ArcGIS, in 2000. Regardless of it being discontinued and replaced, some users still find the software useful and hold the opinion it is a superior product for some tasks.
Spatial network analysis software packages are analytic software used to prepare graph-based analysis of spatial networks. They stem from research fields in transportation, architecture, and urban planning. The earliest examples of such software include the work of Garrison (1962), Kansky (1963), Levin (1964), Harary (1969), Rittel (1967), Tabor (1970) and others in the 1960s and 70s. Specific packages address their domain-specific needs, including TransCAD for transportation, GIS for planning and geography, and Axman for Space syntax researchers.
ArcSDE is a server-software sub-system that aims to enable the usage of Relational Database Management Systems for spatial data. The spatial data may then be used as part of a geodatabase.
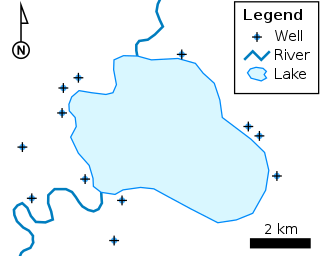
The shapefile format is a geospatial vector data format for geographic information system (GIS) software. It is developed and regulated by Esri as a mostly open specification for data interoperability among Esri and other GIS software products. The shapefile format can spatially describe vector features: points, lines, and polygons, representing, for example, water wells, rivers, and lakes. Each item usually has attributes that describe it, such as name or temperature.
ArcGIS is a family of client, server and online geographic information system (GIS) software developed and maintained by Esri.

gvSIG, geographic information system (GIS), is a desktop application designed for capturing, storing, handling, analyzing and deploying any kind of referenced geographic information in order to solve complex management and planning problems. gvSIG is known for having a user-friendly interface, being able to access the most common formats, both vector and raster ones. It features a wide range of tools for working with geographic-like information.
ArcInfo is a full-featured geographic information system produced by Esri, and is the highest level of licensing in the ArcGIS Desktop product line. It was originally a command-line based system. The command-line processing abilities are now available through the GUI of the ArcGIS Desktop product.
The MapInfo TAB format is a geospatial vector data format for geographic information systems software. It is developed and regulated by Precisely as a proprietary format.
ArcGIS Server is the core server geographic information system (GIS) software made by Esri. ArcGIS Server is used for creating and managing GIS Web services, applications, and data. ArcGIS Server is typically deployed on-premises within the organization’s service-oriented architecture (SOA) or off-premises in a cloud computing environment.
Geospatial metadata is a type of metadata applicable to geographic data and information. Such objects may be stored in a geographic information system (GIS) or may simply be documents, data-sets, images or other objects, services, or related items that exist in some other native environment but whose features may be appropriate to describe in a (geographic) metadata catalog.
ArcView is the entry level licensing level of ArcGIS Desktop, a geographic information system software product produced by Esri. It is intended by Esri to be the logical migration path from ArcView 3.x.
A georelational data model is a geographic data model that represents geographic features as an interrelated set of spatial and attribute data. The georelational model was the dominant form of vector file format during the 1980s and 1990s, including the Esri coverage and Shapefile.
The following tables compare general and technical information for a number of GIS vector file format. Please see the individual products' articles for further information. Unless otherwise specified in footnotes, comparisons are based on the stable versions without any add-ons, extensions or external programs.

ArcGIS CityEngine is a commercial three-dimensional (3D) modeling program developed by Esri R&D Center Zurich and specialises in the generation of 3D urban environments. Using a procedural modeling approach, it supports the creation of detailed large-scale 3D city models. CityEngine works with architectural object placement and arrangement in the same manner that software like VUE manages terrain, ecosystems and atmosphere mapping. Unlike the traditional 3D modeling methodology which uses Computer-Aided Design (CAD) tools and techniques, CityEngine takes a different approach to shape generation via a rule-based system. It can also use Geographic Information System (GIS) datasets due to its integration with the wider Esri/ArcGIS platform. Due to this unique feature set, CityEngine has been used in academic research and built environment professions, e.g., urban planning, architecture, visualization, game development, entertainment, archeology, military and cultural heritage. CityEngine can be used within Building Information Model (BIM) workflows as well as visualizing the data of buildings in a larger urban context, enhancing its working scenario toward real construction projects.
Geographic information systems (GIS) play a constantly evolving role in geospatial intelligence (GEOINT) and United States national security. These technologies allow a user to efficiently manage, analyze, and produce geospatial data, to combine GEOINT with other forms of intelligence collection, and to perform highly developed analysis and visual production of geospatial data. Therefore, GIS produces up-to-date and more reliable GEOINT to reduce uncertainty for a decisionmaker. Since GIS programs are Web-enabled, a user can constantly work with a decision maker to solve their GEOINT and national security related problems from anywhere in the world. There are many types of GIS software used in GEOINT and national security, such as Google Earth, ERDAS IMAGINE, GeoNetwork opensource, and Esri ArcGIS.
A Geodatabase is a proprietary GIS file format developed in the late 1990s by Esri to represent, store, and organize spatial datasets within a geographic information system. A geodatabase is both a logical data model and the physical implementation of that logical model in several proprietary file formats released during the 2000s. The geodatabase design is based on the spatial database model for storing spatial data in relational and object-relational databases. Given the dominance of Esri in the GIS industry, the term "geodatabase" is used by some as a generic trademark for any spatial database, regardless of platform or design.
References
- ↑ "ArcMap Life Cycle". Esri . Retrieved 2024-07-18.
- ↑ Angel, Javier (October 21, 2020). "ArcMap Continued Support". Esri . Retrieved 2020-12-09.
- ↑ "Using the table of contents—Help | ArcGIS for Desktop". desktop.arcgis.com. Retrieved 2015-12-10.
- ↑ "Displaying maps in data view and layout view—Help | ArcGIS for Desktop". desktop.arcgis.com. Retrieved 2015-12-10.
- ↑ "Displaying maps in data view and layout view—Help | ArcGIS for Desktop". desktop.arcgis.com. Retrieved 2015-12-10.