
In the mathematical field of numerical analysis, interpolation is a type of estimation, a method of constructing (finding) new data points based on the range of a discrete set of known data points.
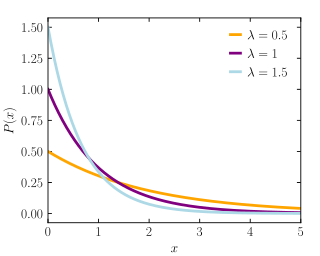
In probability theory and statistics, the exponential distribution is the probability distribution of the time between events in a Poisson point process, i.e., a process in which events occur continuously and independently at a constant average rate. It is a particular case of the gamma distribution. It is the continuous analogue of the geometric distribution, and it has the key property of being memoryless. In addition to being used for the analysis of Poisson point processes it is found in various other contexts.
In numerical analysis, polynomial interpolation is the interpolation of a given data set by the polynomial of lowest possible degree that passes through the points of the dataset.
In mathematics, a Gaussian function, often simply referred to as a Gaussian, is a function of the base form
In probability theory and statistics, a Gaussian process is a stochastic process, such that every finite collection of those random variables has a multivariate normal distribution, i.e. every finite linear combination of them is normally distributed. The distribution of a Gaussian process is the joint distribution of all those random variables, and as such, it is a distribution over functions with a continuous domain, e.g. time or space.
The Gram–Charlier A series, and the Edgeworth series are series that approximate a probability distribution in terms of its cumulants. The series are the same; but, the arrangement of terms differ. The key idea of these expansions is to write the characteristic function of the distribution whose probability density function f is to be approximated in terms of the characteristic function of a distribution with known and suitable properties, and to recover f through the inverse Fourier transform.

In numerical analysis, the order of convergence and the rate of convergence of a convergent sequence are quantities that represent how quickly the sequence approaches its limit. A sequence that converges to is said to have order of convergence and rate of convergence if
Phase correlation is an approach to estimate the relative translative offset between two similar images or other data sets. It is commonly used in image registration and relies on a frequency-domain representation of the data, usually calculated by fast Fourier transforms. The term is applied particularly to a subset of cross-correlation techniques that isolate the phase information from the Fourier-space representation of the cross-correlogram.
Inverse distance weighting (IDW) is a type of deterministic method for multivariate interpolation with a known scattered set of points. The assigned values to unknown points are calculated with a weighted average of the values available at the known points.
In numerical analysis, multivariate interpolation is interpolation on functions of more than one variable; when the variates are spatial coordinates, it is also known as spatial interpolation.
In probability and statistics, the Tweedie distributions are a family of probability distributions which include the purely continuous normal, gamma and inverse Gaussian distributions, the purely discrete scaled Poisson distribution, and the class of compound Poisson–gamma distributions which have positive mass at zero, but are otherwise continuous. Tweedie distributions are a special case of exponential dispersion models and are often used as distributions for generalized linear models.
In image analysis, the generalized structure tensor (GST) is an extension of the Cartesian structure tensor to curvilinear coordinates. It is mainly used to detect and to represent the "direction" parameters of curves, just as the Cartesian structure tensor detects and represents the direction in Cartesian coordinates. Curve families generated by pairs of locally orthogonal functions have been the best studied.
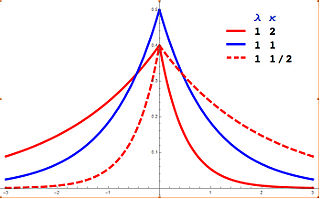
In probability theory and statistics, the asymmetric Laplace distribution (ALD) is a continuous probability distribution which is a generalization of the Laplace distribution. Just as the Laplace distribution consists of two exponential distributions of equal scale back-to-back about x = m, the asymmetric Laplace consists of two exponential distributions of unequal scale back to back about x = m, adjusted to assure continuity and normalization. The difference of two variates exponentially distributed with different means and rate parameters will be distributed according to the ALD. When the two rate parameters are equal, the difference will be distributed according to the Laplace distribution.
In statistics, the complex Wishart distribution is a complex version of the Wishart distribution. It is the distribution of times the sample Hermitian covariance matrix of zero-mean independent Gaussian random variables. It has support for Hermitian positive definite matrices.
Radial basis function (RBF) interpolation is an advanced method in approximation theory for constructing high-order accurate interpolants of unstructured data, possibly in high-dimensional spaces. The interpolant takes the form of a weighted sum of radial basis functions, like for example Gaussian distributions. RBF interpolation is a mesh-free method, meaning the nodes need not lie on a structured grid, and does not require the formation of a mesh. It is often spectrally accurate and stable for large numbers of nodes even in high dimensions.
In numerical analysis, the ITP method, short for Interpolate Truncate and Project, is the first root-finding algorithm that achieves the superlinear convergence of the secant method while retaining the optimal worst-case performance of the bisection method. It is also the first method with guaranteed average performance strictly better than the bisection method under any continuous distribution. In practice it performs better than traditional interpolation and hybrid based strategies, since it not only converges super-linearly over well behaved functions but also guarantees fast performance under ill-behaved functions where interpolations fail.
Kaniadakis statistics is a generalization of the ordinary Boltzmann-Gibbs statistical mechanics, based on a new entropic functional commonly referred to as Kaniadakis entropy or κ-entropy, introduced as the relativistic generalization of the classical Boltzmann-Gibbs-Shannon entropy, by the Greek-Italian physicist Giorgio Kaniadakis in 2001. The κ-statistical mechanics preserves the main features of ordinary statistical mechanics and has attracted the interest of many researchers in the last decades. The κ-distribution is currently considered one of the most viable candidates for explaining complex physical, natural or artificial systems involving power-law tailed statistical distributions. The κ-statistics has been adopted successfully in the description of a variety of systems in the fields of cosmology and astrophysics, condensed matter, quantum physics, seismology, genomics, economy, epidemiology, among many others.

The Kaniadakis Gaussian distribution is a probability distribution which arises as a generalization of the Gaussian distribution from the maximization of the Kaniadakis entropy under appropriated constraints. It is one example of a Kaniadakis κ-distribution. The κ-Gaussian distribution has been applied successfully for describing several complex systems in economy, geophysics, astrophysics, among many others.

The Kaniadakis Logistic distribution is a generalized version of the Logistic distribution associated with the Kaniadakis statistics. It is one example of a Kaniadakis distribution. The κ-Logistic probability distribution describes the population kinetics behavior of bosonic or fermionic character.
In statistics, a Kaniadakis distribution is a statistical distribution that emerges from the Kaniadakis statistics. There are several families of Kaniadakis distributions related to different constraints used in the maximization of the Kaniadakis entropy, such as the κ-Exponential distribution, κ-Gaussian distribution, Kaniadakis κ-Gamma distribution and κ-Weibull distribution. The κ-distributions have been applied for modeling a vast phenomenology of experimental statistical distributions in natural or artificial complex systems, such as, in epidemiology, quantum statistics, in astrophysics and cosmology, in geophysics, in economy, in machine learning.


