
A circle is a shape consisting of all points in a plane that are at a given distance from a given point, the centre. The distance between any point of the circle and the centre is called the radius.
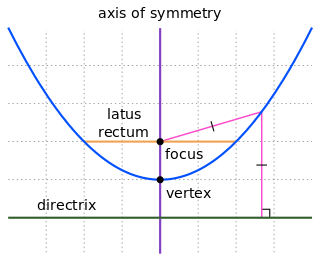
In mathematics, a parabola (/pɛər’əbəʊlə/) is a plane curve which is mirror-symmetrical and is approximately U-shaped. It fits several superficially different mathematical descriptions, which can all be proved to define exactly the same curves.
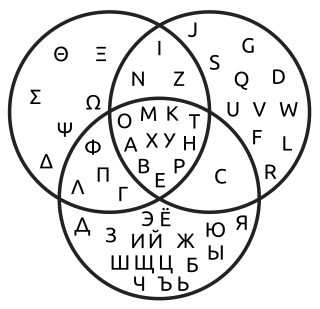
A Venn diagram is a widely used diagram style that shows the logical relation between sets, popularized by John Venn (1834–1923) in the 1880s. The diagrams are used to teach elementary set theory, and to illustrate simple set relationships in probability, logic, statistics, linguistics and computer science. A Venn diagram uses simple closed curves drawn on a plane to represent sets. Very often, these curves are circles or ellipses.

In geometry, two geometric objects are perpendicular if their intersection forms right angles at the point of intersection called a foot. The condition of perpendicularity may be represented graphically using the perpendicular symbol, ⟂. Perpendicular intersections can happen between two lines, between a line and a plane, and between two planes.
In a musical composition, a chord progression or harmonic progression is a succession of chords. Chord progressions are the foundation of harmony in Western musical tradition from the common practice era of Classical music to the 21st century. Chord progressions are the foundation of popular music styles, traditional music, as well as genres such as blues and jazz. In these genres, chord progressions are the defining feature on which melody and rhythm are built.

In music theory, the circle of fifths is a way of organizing the 12 chromatic pitches as a sequence of perfect fifths.. If C is chosen as a starting point, the sequence is: C, G, D, A, E, B, F♯, C♯, A♭, E♭, B♭, F. Continuing the pattern from F returns the sequence to its starting point of C. This order places the most closely related key signatures adjacent to one another. It is usually illustrated in the form of a circle.

In four-dimensional geometry, the 24-cell is the convex regular 4-polytope (four-dimensional analogue of a Platonic solid) with Schläfli symbol {3,4,3}. It is also called C24, or the icositetrachoron, octaplex (short for "octahedral complex"), icosatetrahedroid, octacube, hyper-diamond or polyoctahedron, being constructed of octahedral cells.

Graph drawing is an area of mathematics and computer science combining methods from geometric graph theory and information visualization to derive two-dimensional depictions of graphs arising from applications such as social network analysis, cartography, linguistics, and bioinformatics.

In geometry, the problem of dividing a circle into areas by means of an inscribed polygon with n sides in such a way as to maximise the number of areas created by the edges and diagonals, sometimes called Moser's circle problem, has a solution by an inductive method. The greatest possible number of regions, rG = , giving the sequence 1, 2, 4, 8, 16, 31, 57, 99, 163, 256, .... Though the first five terms match the geometric progression 2n − 1, it deviates at n = 6, showing the risk of generalising from only a few observations.

In geometry, an inscribed angle is the angle formed in the interior of a circle when two chords intersect on the circle. It can also be defined as the angle subtended at a point on the circle by two given points on the circle.
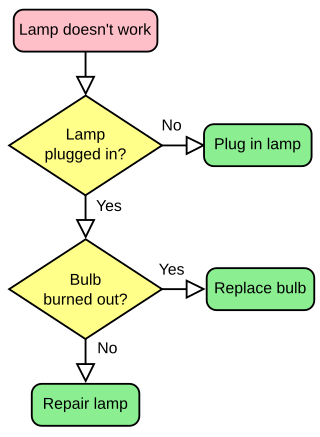
A flowchart is a type of diagram that represents a workflow or process. A flowchart can also be defined as a diagrammatic representation of an algorithm, a step-by-step approach to solving a task.

A pie chart is a circular statistical graphic which is divided into slices to illustrate numerical proportion. In a pie chart, the arc length of each slice is proportional to the quantity it represents. While it is named for its resemblance to a pie which has been sliced, there are variations on the way it can be presented. The earliest known pie chart is generally credited to William Playfair's Statistical Breviary of 1801.
Coltrane changes are a harmonic progression variation using substitute chords over common jazz chord progressions. These substitution patterns were first demonstrated by jazz musician John Coltrane on the albums Bags & Trane and Cannonball Adderley Quintet in Chicago. Coltrane continued his explorations on the 1960 album Giant Steps and expanded on the substitution cycle in his compositions "Giant Steps" and "Countdown", the latter of which is a reharmonized version of Eddie Vinson's "Tune Up". The Coltrane changes are a standard advanced harmonic substitution used in jazz improvisation.

The chromatic circle is a clock diagram for displaying relationships among the 12 equal-tempered pitch classes making up the familiar chromatic scale on a circle.
An arpeggio is a type of broken chord in which the notes that compose a chord are individually sounded in a progressive rising or descending order. Arpeggios on keyboard instruments may be called rolled chords.
In the mathematical theory of knots, the Kontsevich invariant, also known as the Kontsevich integral of an oriented framed link, is a universal Vassiliev invariant in the sense that any coefficient of the Kontsevich invariant is of a finite type, and conversely any finite type invariant can be presented as a linear combination of such coefficients. It was defined by Maxim Kontsevich.

Tablature is a form of musical notation indicating instrument fingering or the location of the played notes rather than musical pitches.

The Stradella Bass System is a buttonboard layout equipped on the bass side of many accordions, which uses columns of buttons arranged in a circle of fifths; this places the principal major chords of a key in three adjacent columns.

A chord diagram is a graphical method of displaying the inter-relationships between data in a matrix. The data are arranged radially around a circle with the relationships between the data points typically drawn as arcs connecting the data.
In mathematics, a chord diagram consists of a cyclic order on a set of objects, together with a one-to-one pairing of those objects. Chord diagrams are conventionally visualized by arranging the objects in their order around a circle, and drawing the pairs of the matching as chords of the circle.