In economics, the Gini coefficient, also known as the Gini index or Gini ratio, is a measure of statistical dispersion intended to represent the income inequality or the wealth inequality within a nation or a social group. The Gini coefficient was developed by the statistician and sociologist Corrado Gini.

In descriptive statistics, summary statistics are used to summarize a set of observations, in order to communicate the largest amount of information as simply as possible. Statisticians commonly try to describe the observations in

In probability theory and statistics, skewness is a measure of the asymmetry of the probability distribution of a real-valued random variable about its mean. The skewness value can be positive, zero, negative, or undefined.
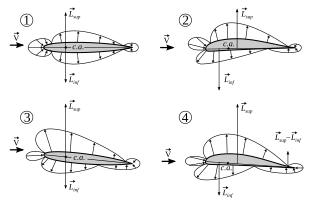
The center of pressure is the point where the total sum of a pressure field acts on a body, causing a force to act through that point. The total force vector acting at the center of pressure is the value of the integrated vectorial pressure field. The resultant force and center of pressure location produce equivalent force and moment on the body as the original pressure field. Pressure fields occur in both static and dynamic fluid mechanics. Specification of the center of pressure, the reference point from which the center of pressure is referenced, and the associated force vector allows the moment generated about any point to be computed by a translation from the reference point to the desired new point. It is common for the center of pressure to be located on the body, but in fluid flows it is possible for the pressure field to exert a moment on the body of such magnitude that the center of pressure is located outside the body.

In statistics, correlation or dependence is any statistical relationship, whether causal or not, between two random variables or bivariate data. Although in the broadest sense, "correlation" may indicate any type of association, in statistics it normally refers to the degree to which a pair of variables are linearly related. Familiar examples of dependent phenomena include the correlation between the height of parents and their offspring, and the correlation between the price of a good and the quantity the consumers are willing to purchase, as it is depicted in the so-called demand curve.

Flight dynamics is the science of air vehicle orientation and control in three dimensions. The three critical flight dynamics parameters are the angles of rotation in three dimensions about the vehicle's center of gravity (cg), known as pitch, roll and yaw.

In statistics, the Pearson correlation coefficient ― also known as Pearson's r, the Pearson product-moment correlation coefficient (PPMCC), the bivariate correlation, or colloquially simply as the correlation coefficient ― is a measure of linear correlation between two sets of data. It is the ratio between the covariance of two variables and the product of their standard deviations; thus, it is essentially a normalized measurement of the covariance, such that the result always has a value between −1 and 1. As with covariance itself, the measure can only reflect a linear correlation of variables, and ignores many other types of relationships or correlations. As a simple example, one would expect the age and height of a sample of teenagers from a high school to have a Pearson correlation coefficient significantly greater than 0, but less than 1.

In statistics, Spearman's rank correlation coefficient or Spearman's ρ, named after Charles Spearman and often denoted by the Greek letter (rho) or as , is a nonparametric measure of rank correlation. It assesses how well the relationship between two variables can be described using a monotonic function.

In aeronautics, the aspect ratio of a wing is the ratio of its span to its mean chord. It is equal to the square of the wingspan divided by the wing area. Thus, a long, narrow wing has a high aspect ratio, whereas a short, wide wing has a low aspect ratio.

An airfoil or aerofoil is the cross-sectional shape of an object whose motion through a gas is capable of generating significant lift, such as a wing, a sail, or the blades of propeller, rotor, or turbine.
The lift coefficient (CL) is a dimensionless coefficient that relates the lift generated by a lifting body to the fluid density around the body, the fluid velocity and an associated reference area. A lifting body is a foil or a complete foil-bearing body such as a fixed-wing aircraft. CL is a function of the angle of the body to the flow, its Reynolds number and its Mach number. The section lift coefficient cl refers to the dynamic lift characteristics of a two-dimensional foil section, with the reference area replaced by the foil chord.

Kappa is the 10th letter of the Greek alphabet, used to represent the [] sound in Ancient and Modern Greek. In the system of Greek numerals, Kʹ has a value of 20. It was derived from the Phoenician letter kaph . Letters that arose from kappa include the Roman K and Cyrillic К.

The Daubechies wavelets, based on the work of Ingrid Daubechies, are a family of orthogonal wavelets defining a discrete wavelet transform and characterized by a maximal number of vanishing moments for some given support. With each wavelet type of this class, there is a scaling function which generates an orthogonal multiresolution analysis.
In statistics, a contingency table is a type of table in a matrix format that displays the (multivariate) frequency distribution of the variables. They are heavily used in survey research, business intelligence, engineering, and scientific research. They provide a basic picture of the interrelation between two variables and can help find interactions between them. The term contingency table was first used by Karl Pearson in "On the Theory of Contingency and Its Relation to Association and Normal Correlation", part of the Drapers' Company Research Memoirs Biometric Series I published in 1904.
In probability theory and statistics, the coefficient of variation (CV), also known as relative standard deviation (RSD), is a standardized measure of dispersion of a probability distribution or frequency distribution. It is often expressed as a percentage, and is defined as the ratio of the standard deviation to the mean . The CV or RSD is widely used in analytical chemistry to express the precision and repeatability of an assay. It is also commonly used in fields such as engineering or physics when doing quality assurance studies and ANOVA gauge R&R. In addition, CV is utilized by economists and investors in economic models.

In statistics, the coefficient of determination, denoted R2 or r2 and pronounced "R squared", is the proportion of the variation in the dependent variable that is predictable from the independent variable(s).

The torques or moments acting on an airfoil moving through a fluid can be accounted for by the net lift and net drag applied at some point on the airfoil, and a separate net pitching moment about that point whose magnitude varies with the choice of where the lift is chosen to be applied. The aerodynamic center is the point at which the pitching moment coefficient for the airfoil does not vary with lift coefficient, making analysis simpler.

In aerodynamics, the pitching moment on an airfoil is the moment produced by the aerodynamic force on the airfoil if that aerodynamic force is considered to be applied, not at the center of pressure, but at the aerodynamic center of the airfoil. The pitching moment on the wing of an airplane is part of the total moment that must be balanced using the lift on the horizontal stabilizer. More generally, a pitching moment is any moment acting on the pitch axis of a moving body.
In statistics, L-moments are a sequence of statistics used to summarize the shape of a probability distribution. They are linear combinations of order statistics (L-statistics) analogous to conventional moments, and can be used to calculate quantities analogous to standard deviation, skewness and kurtosis, termed the L-scale, L-skewness and L-kurtosis respectively. Standardised L-moments are called L-moment ratios and are analogous to standardized moments. Just as for conventional moments, a theoretical distribution has a set of population L-moments. Sample L-moments can be defined for a sample from the population, and can be used as estimators of the population L-moments.
A correlation coefficient is a numerical measure of some type of correlation, meaning a statistical relationship between two variables. The variables may be two columns of a given data set of observations, often called a sample, or two components of a multivariate random variable with a known distribution.


