Related Research Articles

A descriptive statistic is a summary statistic that quantitatively describes or summarizes features from a collection of information, while descriptive statistics is the process of using and analysing those statistics. Descriptive statistic is distinguished from inferential statistics by its aim to summarize a sample, rather than use the data to learn about the population that the sample of data is thought to represent. This generally means that descriptive statistics, unlike inferential statistics, is not developed on the basis of probability theory, and are frequently nonparametric statistics. Even when a data analysis draws its main conclusions using inferential statistics, descriptive statistics are generally also presented. For example, in papers reporting on human subjects, typically a table is included giving the overall sample size, sample sizes in important subgroups, and demographic or clinical characteristics such as the average age, the proportion of subjects of each sex, the proportion of subjects with related co-morbidities, etc.
In the social sciences, scaling is the process of measuring or ordering entities with respect to quantitative attributes or traits. For example, a scaling technique might involve estimating individuals' levels of extraversion, or the perceived quality of products. Certain methods of scaling permit estimation of magnitudes on a continuum, while other methods provide only for relative ordering of the entities.
Social research is a research conducted by social scientists following a systematic plan. Social research methodologies can be classified as quantitative and qualitative.
Quantitative research is a research strategy that focuses on quantifying the collection and analysis of data. It is formed from a deductive approach where emphasis is placed on the testing of theory, shaped by empiricist and positivist philosophies.

Dependent and independent variables are variables in mathematical modeling, statistical modeling and experimental sciences. Dependent variables receive this name because, in an experiment, their values are studied under the supposition or demand that they depend, by some law or rule, on the values of other variables. Independent variables, in turn, are not seen as depending on any other variable in the scope of the experiment in question. In this sense, some common independent variables are time, space, density, mass, fluid flow rate, and previous values of some observed value of interest to predict future values.

A Likert scale is a psychometric scale commonly involved in research that employs questionnaires. It is the most widely used approach to scaling responses in survey research, such that the term is often used interchangeably with rating scale, although there are other types of rating scales.
Level of measurement or scale of measure is a classification that describes the nature of information within the values assigned to variables. Psychologist Stanley Smith Stevens developed the best-known classification with four levels, or scales, of measurement: nominal, ordinal, interval, and ratio. This framework of distinguishing levels of measurement originated in psychology and is widely criticized by scholars in other disciplines. Other classifications include those by Mosteller and Tukey, and by Chrisman.

A questionnaire is a research instrument that consists of a set of questions for the purpose of gathering information from respondents through survey or statistical study. A research questionnaire is typically a mix of close-ended questions and open-ended questions. Open-ended, long-term questions offer the respondent the ability to elaborate on their thoughts. The Research questionnaire was developed by the Statistical Society of London in 1838.
In the analysis of multivariate observations designed to assess subjects with respect to an attribute, a Guttman scale is a single (unidimensional) ordinal scale for the assessment of the attribute, from which the original observations may be reproduced. The discovery of a Guttman scale in data depends on their multivariate distribution's conforming to a particular structure. Hence, a Guttman scale is a hypothesis about the structure of the data, formulated with respect to a specified attribute and a specified population and cannot be constructed for any given set of observations. Contrary to a widespread belief, a Guttman scale is not limited to dichotomous variables and does not necessarily determine an order among the variables. But if variables are all dichotomous, the variables are indeed ordered by their sensitivity in recording the assessed attribute, as illustrated by Example 1.
A ranking is a relationship between a set of items such that, for any two items, the first is either "ranked higher than", "ranked lower than" or "ranked equal to" the second. In mathematics, this is known as a weak order or total preorder of objects. It is not necessarily a total order of objects because two different objects can have the same ranking. The rankings themselves are totally ordered. For example, materials are totally preordered by hardness, while degrees of hardness are totally ordered. If two items are the same in rank it is considered a tie.
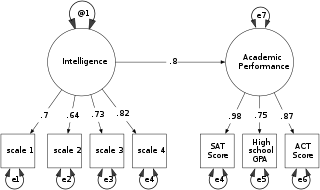
Structural equation modeling (SEM) is a label for a diverse set of methods used by scientists in both experimental and observational research across the sciences, business, and other fields. It is used most in the social and behavioral sciences. A definition of SEM is difficult without reference to highly technical language, but a good starting place is the name itself.
A double-barreled question is an informal fallacy. It is committed when someone asks a question that touches upon more than one issue, yet allows only for one answer. This may result in inaccuracies in the attitudes being measured for the question, as the respondent can answer only one of the two questions, and cannot indicate which one is being answered.

Earl Robert Babbie, is an American sociologist who holds the position of Campbell Professor Emeritus in Behavioral Sciences at Chapman University. He is best known for his book The Practice of Social Research, currently in its 15th English edition, with numerous non-English editions.
In statistics, confirmatory factor analysis (CFA) is a special form of factor analysis, most commonly used in social science research. It is used to test whether measures of a construct are consistent with a researcher's understanding of the nature of that construct. As such, the objective of confirmatory factor analysis is to test whether the data fit a hypothesized measurement model. This hypothesized model is based on theory and/or previous analytic research. CFA was first developed by Jöreskog (1969) and has built upon and replaced older methods of analyzing construct validity such as the MTMM Matrix as described in Campbell & Fiske (1959).

Bivariate analysis is one of the simplest forms of quantitative (statistical) analysis. It involves the analysis of two variables, for the purpose of determining the empirical relationship between them.
In science and research, an attribute is a quality of an object. Attributes are closely related to variables. A variable is a logical set of attributes. Variables can "vary" – for example, be high or low. How high, or how low, is determined by the value of the attribute. (For example see: Binary option)
In statistics and research design, an index is a composite statistic – a measure of changes in a representative group of individual data points, or in other words, a compound measure that aggregates multiple indicators. Indexes – also known as composite indicators – summarize and rank specific observations.
In statistics and research design, an indicator is an observed value of a variable, or in other words "a sign of a presence or absence of the concept being studied". Just like each color indicates in a traffic lights the change in the movement.
Typology is a composite measure that involves the classification of observations in terms of their attributes on multiple variables. Such classification is usually done on a nominal scale. Typologies are used in both qualitative and quantitative research.
Univariate is a term commonly used in statistics to describe a type of data which consists of observations on only a single characteristic or attribute. A simple example of univariate data would be the salaries of workers in industry. Like all the other data, univariate data can be visualized using graphs, images or other analysis tools after the data is measured, collected, reported, and analyzed.
References
- 1 2 3 4 5 Earl Babbie (1 January 2012). The Practice of Social Research. Cengage Learning. p. 162. ISBN 1-133-04979-6.
- ↑ Earl Babbie (1 January 2012). The Practice of Social Research. Cengage Learning. p. 164. ISBN 1-133-04979-6.
- ↑ Earl Babbie (1 January 2012). The Practice of Social Research. Cengage Learning. p. 177. ISBN 1-133-04979-6.
- 1 2 Earl Babbie (1 January 2012). The Practice of Social Research. Cengage Learning. p. 185. ISBN 1-133-04979-6.
- 1 2 Earl Babbie (1 January 2012). The Practice of Social Research. Cengage Learning. pp. 173–175. ISBN 1-133-04979-6.
| | This statistics-related article is a stub. You can help Wikipedia by expanding it. |