Contribution margin

Last updated

Contribution margin (CM), or dollar contribution per unit, is the selling price per unit minus the variable cost per unit. "Contribution" represents the portion of sales revenue that is not consumed by variable costs and so contributes to the coverage of fixed costs. This concept is one of the key building blocks of break-even analysis. [1]

Contents

Decomposing Sales as Contribution plus Variable Costs. In the Cost-Volume-Profit Analysis model, costs are linear in volume. CVP-Sales-Contrib-VC.svg
Decomposing Sales as Contribution plus Variable Costs. In the Cost-Volume-Profit Analysis model, costs are linear in volume.

In cost-volume-profit analysis, a form of management accounting, contribution margin—the marginal profit per unit sale—is a useful quantity in carrying out various calculations, and can be used as a measure of operating leverage. [2] Typically, low contribution margins are prevalent in the labor-intensive service sector while high contribution margins are prevalent in the capital-intensive industrial sector.

Purpose

In Cost-Volume-Profit Analysis, where it simplifies calculation of net income and, especially, break-even analysis.

Given the contribution margin, a manager can easily compute breakeven and target income sales, and make better decisions about whether to add or subtract a product line, about how to price a product or service, and about how to structure sales commissions or bonuses.

Contribution margin analysis is a measure of operating leverage; it measures how growth in sales translates to growth in profits.

The contribution margin is computed by using a contribution income statement, a management accounting version of the income statement that has been reformatted to group together a business's fixed and variable costs.

Contribution is different from gross margin in that a contribution calculation seeks to separate out variable costs (included in the contribution calculation) from fixed costs (not included in the contribution calculation) on the basis of economic analysis of the nature of the expense, whereas gross margin is determined using accounting standards. Calculating the contribution margin is an excellent tool for managers to help determine whether to keep or drop certain aspects of the business. For example, a production line with positive contribution margin should be kept even if it causes negative total profit, when the contribution margin offsets part of the fixed cost. However, it should be dropped if contribution margin is negative because the company would suffer from every unit it produces. [3]

The contribution margin analysis is also applicable when the tax authority performs tax investigations, by identifying target interviewees who have unusually high contribution margin ratios compared to other companies in the same industry. [4]

Contribution margin is also one of the factors to judge whether a company has monopoly power in competition law, such as use of the Lerner index test. [4] [5]

Contribution

The Unit Contribution Margin (C) is Unit Revenue (Price, P) minus Unit Variable Cost (V):

[1]

The Contribution Margin Ratio is the percentage of Contribution over Total Revenue, which can be calculated from the unit contribution over unit price or total contribution over Total Revenue:

For example, if the price is $10 and the unit variable cost is $2, then the unit contribution margin is $8, and the contribution margin ratio is $8/$10 = 80%.

Profit and Loss as Contribution minus Fixed Costs. CVP-FC-Contrib-PL.svg
Profit and Loss as Contribution minus Fixed Costs .

Contribution margin can be thought of as the fraction of sales that contributes to the offset of fixed costs. Alternatively, unit contribution margin is the amount each unit sale adds to profit: it is the slope of the profit line.

Cost-Volume-Profit Analysis (CVP): assuming the linear CVP model, the computation of Profit and Loss (Net Income) reduces as follows:

where TC = TFC + TVC is Total Cost = Total Fixed Cost + Total Variable Cost and X is Number of Units. Thus Profit is the Contribution Margin times Number of Units, minus the Total Fixed Costs.

The above formula is derived as follows:

From the perspective of the matching principle, one breaks down the revenue from a given sale into a part to cover the Unit Variable Cost, and a part to offset against the Total Fixed Costs. Breaking down Total Costs as:

one breaks down Total Revenue as:

Thus the Total Variable Costs offset, and the Net Income (Profit and Loss) is Total Contribution Margin minus Total Fixed Costs:

Combined Profit Volume Ratio can be calculated by using following formula

Combined Profit Volume Ratio = Combined Contribution/Combined Sale * 100

Examples

Beta Sales Company Contribution Format Income Statement For Year Ended December 31, 201X
Sales$ 462,452
Less Variable Costs
Cost of Goods Sold
Sales Commissions
Delivery Charges
$ 230,934
$ 58,852
$ 13,984
Total Variable Costs$ 303,770
Contribution Margin (34%)$ 158,682
Less Fixed Costs
Advertising
Depreciation
Insurance
Payroll Taxes
Rent
Utilities
Wages
$ 1,850
$ 13,250
$ 5,400
$ 8,200
$ 9,600
$ 17,801
$ 40,000
Total Fixed Costs$ 96,101
Net Operating Income $ 62,581

The Beta Company's contribution margin for the year was 34 percent. This means that, for every dollar of sales, after the costs that were directly related to the sales were subtracted, 34 cents remained to contribute toward paying for the indirect (fixed) costs and later for profit.

Contribution format income statements can be drawn up with data from more than one year's income statements, when a person is interested in tracking contribution margins over time. Perhaps even more usefully, they can be drawn up for each product line or service. Here's an example, showing a breakdown of Beta's three main product lines.

Line ALine BLine C
Sales$120,400$202,050$140,002
Less Variable Costs
Cost of Goods Sold$70,030$100,900$60,004
Sales Commissions$18,802$40,050$0
Delivery Charges$ 900$ 8,084$ 5,000
Total Variable Costs$ 89,732$ 149,034$ 65,004
Contribution Margin$ 30,668$ 53,016$ 74,998
percentage25%26%54%

Although this shows only the top half of the contribution format income statement, it's immediately apparent that Product Line C is Beta's most profitable one, even though Beta gets more sales revenue from Line B (which is also an example of what is called Partial Contribution Margin - an income statement that references only variable costs). It appears that Beta would do well by emphasizing Line C in its product mix. Moreover, the statement indicates that perhaps prices for line A and line B products are too low. This is information that can't be gleaned from the regular income statements that an accountant routinely draws up each period.

Contribution margin as a measure of efficiency in the operating room

The following discussion focuses on contribution margin (mean) per operating room hour in the operating room and how it relates to operating room efficiency.

Metric measures [6] 012
Excess staffing costs > 10%5-10%< 5%
Start-time tardiness (mean tardiness for elective cases/day)> 60 min45–60 min< 45 min
Case cancellation rate > 10%5–10%< 5%
Post Anesthesia Care Unit (PACU) admission delays (% workdays with at least one delay in PACU admission)> 20%10–20%< 10%
Contribution Margin (mean) per operating room hour< $1,000/h $1–2,000/h> $2,000/h
Operating room turnover time (mean setup and cleanup turnover times for all cases)> 40 min25-40 min< 25 min
Prediction bias (bias in case duration estimates per 8 hours of operating room time)> 15 min5–15 min< 5 min
Prolonged turnovers (%turnovers > 60 min)> 25%10–25%< 10%

A surgical suite can schedule itself efficiently but fail to have a positive contribution margin if many surgeons are slow, use too many instruments or expensive implants, etc. These are all measured by the contribution margin per OR hour. The contribution margin per hour of OR time is the hospital revenue generated by a surgical case, less all the hospitalization variable labor and supply costs. Variable costs, such as implants, vary directly with the volume of cases performed.

This is because fee-for-service hospitals have a positive contribution margin for almost all elective cases mostly due to a large percentage of OR costs being fixed. For USA hospitals not on a fixed annual budget, contribution margin per OR hour averages one to two thousand USD per OR hour.

See also

Related Research Articles

In economics, specifically general equilibrium theory, a perfect market, also known as an atomistic market, is defined by several idealizing conditions, collectively called perfect competition, or atomistic competition. In theoretical models where conditions of perfect competition hold, it has been demonstrated that a market will reach an equilibrium in which the quantity supplied for every product or service, including labor, equals the quantity demanded at the current price. This equilibrium would be a Pareto optimum.

<span class="mw-page-title-main">Cost accounting</span> Procedures to optimize practices in cost efficient ways

Cost accounting is defined by the Institute of Management Accountants as "a systematic set of procedures for recording and reporting measurements of the cost of manufacturing goods and performing services in the aggregate and in detail. It includes methods for recognizing, classifying, allocating, aggregating and reporting such costs and comparing them with standard costs". Often considered a subset of managerial accounting, its end goal is to advise the management on how to optimize business practices and processes based on cost efficiency and capability. Cost accounting provides the detailed cost information that management needs to control current operations and plan for the future.

<span class="mw-page-title-main">Profit maximization</span> Process to determine the highest profits for a firm

In economics, profit maximization is the short run or long run process by which a firm may determine the price, input and output levels that will lead to the highest possible total profit. In neoclassical economics, which is currently the mainstream approach to microeconomics, the firm is assumed to be a "rational agent" which wants to maximize its total profit, which is the difference between its total revenue and its total cost.

<span class="mw-page-title-main">Break-even (economics)</span> Equality of costs and revenues

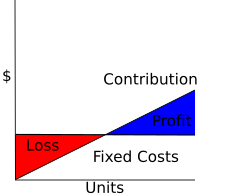
The break-even point (BEP) in economics, business—and specifically cost accounting—is the point at which total cost and total revenue are equal, i.e. "even". There is no net loss or gain, and one has "broken even", though opportunity costs have been paid and capital has received the risk-adjusted, expected return. In short, all costs that must be paid are paid, and there is neither profit nor loss. The break-even analysis was developed by Karl Bücher and Johann Friedrich Schär.

In economics, the marginal cost is the change in the total cost that arises when the quantity produced is increased, i.e. the cost of producing additional quantity. In some contexts, it refers to an increment of one unit of output, and in others it refers to the rate of change of total cost as output is increased by an infinitesimal amount. As Figure 1 shows, the marginal cost is measured in dollars per unit, whereas total cost is in dollars, and the marginal cost is the slope of the total cost, the rate at which it increases with output. Marginal cost is different from average cost, which is the total cost divided by the number of units produced.

<span class="mw-page-title-main">Throughput accounting</span> Principle of management accounting

Throughput accounting (TA) is a principle-based and simplified management accounting approach that provides managers with decision support information for enterprise profitability improvement. TA is relatively new in management accounting. It is an approach that identifies factors that limit an organization from reaching its goal, and then focuses on simple measures that drive behavior in key areas towards reaching organizational goals. TA was proposed by Eliyahu M. Goldratt as an alternative to traditional cost accounting. As such, Throughput Accounting is neither cost accounting nor costing because it is cash focused and does not allocate all costs to products and services sold or provided by an enterprise. Considering the laws of variation, only costs that vary totally with units of output e.g. raw materials, are allocated to products and services which are deducted from sales to determine Throughput. Throughput Accounting is a management accounting technique used as the performance measure in the Theory of Constraints (TOC). It is the business intelligence used for maximizing profits, however, unlike cost accounting that primarily focuses on 'cutting costs' and reducing expenses to make a profit, Throughput Accounting primarily focuses on generating more throughput. Conceptually, Throughput Accounting seeks to increase the speed or rate at which throughput is generated by products and services with respect to an organization's constraint, whether the constraint is internal or external to the organization. Throughput Accounting is the only management accounting methodology that considers constraints as factors limiting the performance of organizations.

<span class="mw-page-title-main">Net income</span> Measure of the profitability of a business venture

In business and accounting, net income is an entity's income minus cost of goods sold, expenses, depreciation and amortization, interest, and taxes for an accounting period.

Profit margin is a financial ratio that measures the percentage of profit earned by a company in relation to its revenue. Expressed as a percentage, it indicates how much profit the company makes for every dollar of revenue generated. Profit margin is important because this percentage provides a comprehensive picture of the operating efficiency of a business or an industry. All margin changes provide useful indicators for assessing growth potential, investment viability and the financial stability of a company relative to its competitors. Maintaining a healthy profit margin will help to ensure the financial success of a business, which will improve its ability to obtain loans.

In business, operating margin—also known as operating income margin, operating profit margin, EBIT margin and return on sales (ROS)—is the ratio of operating income to net sales, usually expressed in percent.

Operating leverage is a measure of how revenue growth translates into growth in operating income. It is a measure of leverage, and of how risky, or volatile, a company's operating income is.

In finance, leverage is any technique involving borrowing funds to buy an investment, estimating that future profits will be more than the cost of borrowing. This technique is named after a lever in physics, which amplifies a small input force into a greater output force, because successful leverage amplifies the smaller amounts of money needed for borrowing into large amounts of profit. However, the technique also involves the high risk of not being able to pay back a large loan. Normally, a lender will set a limit on how much risk it is prepared to take and will set a limit on how much leverage it will permit, and would require the acquired asset to be provided as collateral security for the loan.

<span class="mw-page-title-main">Gross margin</span> Gross profit as a percentage

Gross margin is the difference between revenue and cost of goods sold (COGS), divided by revenue. Gross margin is expressed as a percentage. Generally, it is calculated as the selling price of an item, less the cost of goods sold, then divided by the same selling price. "Gross margin" is often used interchangeably with "gross profit", however, the terms are different: "gross profit" is technically an absolute monetary amount and "gross margin" is technically a percentage or ratio.

<span class="mw-page-title-main">Total cost</span> Total economic cost of production

In economics, total cost (TC) is the minimum financial cost of producing some quantity of output. This is the total economic cost of production and is made up of variable cost, which varies according to the quantity of a good produced and includes inputs such as labor and raw materials, plus fixed cost, which is independent of the quantity of a good produced and includes inputs that cannot be varied in the short term such as buildings and machinery, including possibly sunk costs.

Contribution margin-based pricing is a pricing strategy which works without any mention of gross margin percentages. (German:Deckungsbeitrag) It maximizes the profit derived from a company's assortment, based on the difference between a product's price and variable costs, and on one's assumptions regarding the relationship between the product's price and the number of units that can be sold at that price. The product's contribution to total operating income is maximized when a price is chosen that maximizes the 'contribution margin per unit X number of units sold'.

<span class="mw-page-title-main">Cost–volume–profit analysis</span> Cost accounting model

Cost–volume–profit (CVP), in managerial economics, is a form of cost accounting. It is a simplified model, useful for elementary instruction and for short-run decisions.

<span class="mw-page-title-main">Target income sales</span>

In cost accounting, target income sales are the sales necessary to achieve a given target income. It can be measured either in units or in currency, and can be computed using contribution margin similarly to break-even point:

A firm will choose to implement a shutdown of production when the revenue received from the sale of the goods or services produced cannot even cover the variable costs of production. In that situation, the firm will experience a higher loss when it produces, compared to not producing at all.

In economics, the marginal product of labor (MPL) is the change in output that results from employing an added unit of labor. It is a feature of the production function and depends on the amounts of physical capital and labor already in use.

The purpose of profit-based sales target metrics is "to ensure that marketing and sales objectives mesh with profit targets." In target volume and target revenue calculations, managers go beyond break-even analysis to "determine the level of unit sales or revenues needed not only to cover a firm’s costs but also to attain its profit targets."

The profit model is the linear, deterministic algebraic model used implicitly by most cost accountants. Starting with, profit equals sales minus costs, it provides a structure for modeling cost elements such as materials, losses, multi-products, learning, depreciation etc. It provides a mutable conceptual base for spreadsheet modelers. This enables them to run deterministic simulations or 'what if' modelling to see the impact of price, cost or quantity changes on profitability.

References

  1. 1 2 Farris, Paul W.; Neil T. Bendle; Phillip E. Pfeifer; David J. Reibstein (2010). Marketing Metrics: The Definitive Guide to Measuring Marketing Performance. Upper Saddle River, New Jersey: Pearson Education, Inc. ISBN   0-13-705829-2. The Marketing Accountability Standards Board (MASB) endorses the definitions, purposes, and constructs of classes of measures that appear in Marketing Metrics as part of its ongoing Common Language: Marketing Activities and Metrics Project.
  2. "Contribution Margin Defined". Oracle NetSuite. 2023-06-16. Retrieved 2023-07-31.
  3. Hansen,Don R., and Maryanne M. Mowen, Managerial Accounting p.529, at http://www.usdoj.gov/atr/public/speeches/future.txt
  4. 1 2 Tat Chee Tsui. "Interstate Comparison—Use of Contribution Margin in Determination of Price Fixing." Pace International Law Review (Apr 2011), at: http://works.bepress.com/tatchee_tsui/2 Archived 2011-03-24 at the Wayback Machine
  5. Motta, M. Competition Policy: Theory and Practice (Cambridge 2004), P.110.
  6. Macario, A. "Are Your Hospital Operating Rooms "Efficient"?" Anesthesiology 2006; 105:237–40.


Other sources