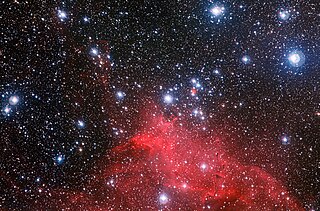
An open cluster is a group of up to a few thousand stars that were formed from the same giant molecular cloud and have roughly the same age. More than 1,100 open clusters have been discovered within the Milky Way Galaxy, and many more are thought to exist. They are loosely bound by mutual gravitational attraction and become disrupted by close encounters with other clusters and clouds of gas as they orbit the galactic center. This can result in a migration to the main body of the galaxy and a loss of cluster members through internal close encounters. Open clusters generally survive for a few hundred million years, with the most massive ones surviving for a few billion years. In contrast, the more massive globular clusters of stars exert a stronger gravitational attraction on their members, and can survive for longer. Open clusters have been found only in spiral and irregular galaxies, in which active star formation is occurring.

Star clusters are groups of stars. Two types of star clusters can be distinguished: globular clusters are tight groups of hundreds or thousands of very old stars which are gravitationally bound, while open clusters, more loosely clustered groups of stars, generally contain fewer than a few hundred members, and are often very young. Open clusters become disrupted over time by the gravitational influence of giant molecular clouds as they move through the galaxy, but cluster members will continue to move in broadly the same direction through space even though they are no longer gravitationally bound; they are then known as a stellar association, sometimes also referred to as a moving group.

A blue straggler is a main-sequence star in an open or globular cluster that is more luminous and bluer than stars at the main sequence turnoff point for the cluster. Blue stragglers were first discovered by Allan Sandage in 1953 while performing photometry of the stars in the globular cluster M3. Standard theories of stellar evolution hold that the position of a star on the Hertzsprung–Russell diagram should be determined almost entirely by the initial mass of the star and its age. In a cluster, stars all formed at approximately the same time, and thus in an H–R diagram for a cluster, all stars should lie along a clearly defined curve set by the age of the cluster, with the positions of individual stars on that curve determined solely by their initial mass. With masses two to three times that of the rest of the main-sequence cluster stars, blue stragglers seem to be exceptions to this rule. The resolution of this problem is likely related to interactions between two or more stars in the dense confines of the clusters in which blue stragglers are found.

The Virgo Cluster is a cluster of galaxies whose center is 53.8 ± 0.3 Mly away in the constellation Virgo. Comprising approximately 1300 member galaxies, the cluster forms the heart of the larger Virgo Supercluster, of which the Local Group is a member. The Local Group actually experiences the mass of the Virgo Supercluster as the Virgocentric flow. It is estimated that the Virgo Cluster's mass is 1.2×10¹⁵M☉ out to 8 degrees of the cluster's center or a radius of about 2.2 Mpc.
UPGMA is a simple agglomerative (bottom-up) hierarchical clustering method. The method is generally attributed to Sokal and Michener.

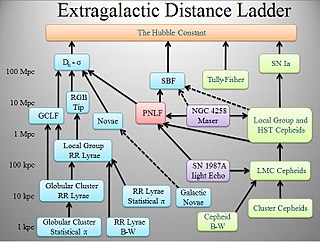
The cosmic distance ladder is the succession of methods by which astronomers determine the distances to celestial objects. A real direct distance measurement of an astronomical object is possible only for those objects that are "close enough" to Earth. The techniques for determining distances to more distant objects are all based on various measured correlations between methods that work at close distances and methods that work at larger distances. Several methods rely on a standard candle, which is an astronomical object that has a known luminosity.

In data mining and statistics, hierarchical clustering is a method of cluster analysis which seeks to build a hierarchy of clusters. Strategies for hierarchical clustering generally fall into two types:
The k-medoids or PAM algorithm is a clustering algorithm reminiscent to the k-means algorithm. Both the k-means and k-medoids algorithms are partitional and both attempt to minimize the distance between points labeled to be in a cluster and a point designated as the center of that cluster. In contrast to the k-means algorithm, k-medoids chooses data points as centers and can be used with arbitrary distances, while in k-means the centre of a clusters is not necessarily one of the input data points. The PAM method was proposed in 1987 for the work with norm and other distances.
In statistics, and especially in biostatistics, cophenetic correlation is a measure of how faithfully a dendrogram preserves the pairwise distances between the original unmodeled data points. Although it has been most widely applied in the field of biostatistics, it can also be used in other fields of inquiry where raw data tend to occur in clumps, or clusters. This coefficient has also been proposed for use as a test for nested clusters.
In statistics, single-linkage clustering is one of several methods of hierarchical clustering. It is based on grouping clusters in bottom-up fashion, at each step combining two clusters that contain the closest pair of elements not yet belonging to the same cluster as each other.

Density-based spatial clustering of applications with noise (DBSCAN) is a data clustering algorithm proposed by Martin Ester, Hans-Peter Kriegel, Jörg Sander and Xiaowei Xu in 1996. It is a density-based clustering algorithm: given a set of points in some space, it groups together points that are closely packed together, marking as outliers points that lie alone in low-density regions . DBSCAN is one of the most common clustering algorithms and also most cited in scientific literature.
Consensus clustering is an important elaboration of traditional cluster analysis. Consensus clustering, also called cluster ensembles or aggregation of clustering, refers to the situation in which a number of different (input) clusterings have been obtained for a particular dataset and it is desired to find a single (consensus) clustering which is a better fit in some sense than the existing clusterings. Consensus clustering is thus the problem of reconciling clustering information about the same data set coming from different sources or from different runs of the same algorithm. When cast as an optimization problem, consensus clustering is known as median partition, and has been shown to be NP-complete, even when the number of input clusterings is three. Consensus clustering for unsupervised learning is analogous to ensemble learning in supervised learning.

The Hertzsprung–Russell diagram, abbreviated as H–R diagram, HR diagram or HRD, is a scatter plot of stars showing the relationship between the stars' absolute magnitudes or luminosities versus their stellar classifications or effective temperatures. More simply, it plots each star on a graph plotting the star's brightness against its temperature (color).
Complete-linkage clustering is one of several methods of agglomerative hierarchical clustering. At the beginning of the process, each element is in a cluster of its own. The clusters are then sequentially combined into larger clusters until all elements end up being in the same cluster. The method is also known as farthest neighbour clustering. The result of the clustering can be visualized as a dendrogram, which shows the sequence of cluster fusion and the distance at which each fusion took place.
In statistics, Ward's method is a criterion applied in hierarchical cluster analysis. Ward's minimum variance method is a special case of the objective function approach originally presented by Joe H. Ward, Jr. Ward suggested a general agglomerative hierarchical clustering procedure, where the criterion for choosing the pair of clusters to merge at each step is based on the optimal value of an objective function. This objective function could be "any function that reflects the investigator's purpose." Many of the standard clustering procedures are contained in this very general class. To illustrate the procedure, Ward used the example where the objective function is the error sum of squares, and this example is known as Ward's method or more precisely Ward's minimum variance method.
In the theory of cluster analysis, the nearest-neighbor chain algorithm is an algorithm that can speed up several methods for agglomerative hierarchical clustering. These are methods that take a collection of points as input, and create a hierarchy of clusters of points by repeatedly merging pairs of smaller clusters to form larger clusters. The clustering methods that the nearest-neighbor chain algorithm can be used for include Ward's method, complete-linkage clustering, and single-linkage clustering; these all work by repeatedly merging the closest two clusters but use different definitions of the distance between clusters. The cluster distances for which the nearest-neighbor chain algorithm works are called reducible and are characterized by a simple inequality among certain cluster distances.
WPGMA is a simple agglomerative (bottom-up) hierarchical clustering method, generally attributed to Sokal and Michener.
Automatic clustering algorithms are algorithms that can perform clustering without prior knowledge of data sets. In contrast with other cluster analysis techniques, automatic clustering algorithms can determine the optimal number of clusters even in the presence of noise and outlier points.


