A likelihood function measures how well a statistical model explains observed data by calculating the probability of seeing that data under different parameter values of the model. It is constructed from the joint probability distribution of the random variable that (presumably) generated the observations. When evaluated on the actual data points, it becomes a function solely of the model parameters.
In statistics, the likelihood-ratio test is a hypothesis test that involves comparing the goodness of fit of two competing statistical models, typically one found by maximization over the entire parameter space and another found after imposing some constraint, based on the ratio of their likelihoods. If the more constrained model is supported by the observed data, the two likelihoods should not differ by more than sampling error. Thus the likelihood-ratio test tests whether this ratio is significantly different from one, or equivalently whether its natural logarithm is significantly different from zero.

In probability theory and statistics, the exponential distribution or negative exponential distribution is the probability distribution of the distance between events in a Poisson point process, i.e., a process in which events occur continuously and independently at a constant average rate; the distance parameter could be any meaningful mono-dimensional measure of the process, such as time between production errors, or length along a roll of fabric in the weaving manufacturing process. It is a particular case of the gamma distribution. It is the continuous analogue of the geometric distribution, and it has the key property of being memoryless. In addition to being used for the analysis of Poisson point processes it is found in various other contexts.
In statistics, maximum likelihood estimation (MLE) is a method of estimating the parameters of an assumed probability distribution, given some observed data. This is achieved by maximizing a likelihood function so that, under the assumed statistical model, the observed data is most probable. The point in the parameter space that maximizes the likelihood function is called the maximum likelihood estimate. The logic of maximum likelihood is both intuitive and flexible, and as such the method has become a dominant means of statistical inference.
In probability and statistics, an exponential family is a parametric set of probability distributions of a certain form, specified below. This special form is chosen for mathematical convenience, including the enabling of the user to calculate expectations, covariances using differentiation based on some useful algebraic properties, as well as for generality, as exponential families are in a sense very natural sets of distributions to consider. The term exponential class is sometimes used in place of "exponential family", or the older term Koopman–Darmois family. Sometimes loosely referred to as "the" exponential family, this class of distributions is distinct because they all possess a variety of desirable properties, most importantly the existence of a sufficient statistic.
In mathematics, particularly in set theory, the beth numbers are a certain sequence of infinite cardinal numbers, conventionally written , where is the Hebrew letter beth. The beth numbers are related to the aleph numbers, but unless the generalized continuum hypothesis is true, there are numbers indexed by that are not indexed by .
In statistics and information theory, a maximum entropy probability distribution has entropy that is at least as great as that of all other members of a specified class of probability distributions. According to the principle of maximum entropy, if nothing is known about a distribution except that it belongs to a certain class, then the distribution with the largest entropy should be chosen as the least-informative default. The motivation is twofold: first, maximizing entropy minimizes the amount of prior information built into the distribution; second, many physical systems tend to move towards maximal entropy configurations over time.
In statistics, Poisson regression is a generalized linear model form of regression analysis used to model count data and contingency tables. Poisson regression assumes the response variable Y has a Poisson distribution, and assumes the logarithm of its expected value can be modeled by a linear combination of unknown parameters. A Poisson regression model is sometimes known as a log-linear model, especially when used to model contingency tables.
In mathematics, for a Lie group , the Kirillov orbit method gives a heuristic method in representation theory. It connects the Fourier transforms of coadjoint orbits, which lie in the dual space of the Lie algebra of G, to the infinitesimal characters of the irreducible representations. The method got its name after the Russian mathematician Alexandre Kirillov.
The Berndt–Hall–Hall–Hausman (BHHH) algorithm is a numerical optimization algorithm similar to the Newton–Raphson algorithm, but it replaces the observed negative Hessian matrix with the outer product of the gradient. This approximation is based on the information matrix equality and therefore only valid while maximizing a likelihood function. The BHHH algorithm is named after the four originators: Ernst R. Berndt, Bronwyn Hall, Robert Hall, and Jerry Hausman.
Proportional hazards models are a class of survival models in statistics. Survival models relate the time that passes, before some event occurs, to one or more covariates that may be associated with that quantity of time. In a proportional hazards model, the unique effect of a unit increase in a covariate is multiplicative with respect to the hazard rate. For example, taking a drug may halve one's hazard rate for a stroke occurring, or, changing the material from which a manufactured component is constructed may double its hazard rate for failure. Other types of survival models such as accelerated failure time models do not exhibit proportional hazards. The accelerated failure time model describes a situation where the biological or mechanical life history of an event is accelerated.
Bayesian linear regression is a type of conditional modeling in which the mean of one variable is described by a linear combination of other variables, with the goal of obtaining the posterior probability of the regression coefficients and ultimately allowing the out-of-sample prediction of the regressandconditional on observed values of the regressors. The simplest and most widely used version of this model is the normal linear model, in which given is distributed Gaussian. In this model, and under a particular choice of prior probabilities for the parameters—so-called conjugate priors—the posterior can be found analytically. With more arbitrarily chosen priors, the posteriors generally have to be approximated.
In probability theory and statistics, the normal-gamma distribution is a bivariate four-parameter family of continuous probability distributions. It is the conjugate prior of a normal distribution with unknown mean and precision.
The Heckman correction is a statistical technique to correct bias from non-randomly selected samples or otherwise incidentally truncated dependent variables, a pervasive issue in quantitative social sciences when using observational data. Conceptually, this is achieved by explicitly modelling the individual sampling probability of each observation together with the conditional expectation of the dependent variable. The resulting likelihood function is mathematically similar to the tobit model for censored dependent variables, a connection first drawn by James Heckman in 1974. Heckman also developed a two-step control function approach to estimate this model, which avoids the computational burden of having to estimate both equations jointly, albeit at the cost of inefficiency. Heckman received the Nobel Memorial Prize in Economic Sciences in 2000 for his work in this field.
In statistics and machine learning, lasso is a regression analysis method that performs both variable selection and regularization in order to enhance the prediction accuracy and interpretability of the resulting statistical model. The lasso method assumes that the coefficients of the linear model are sparse, meaning that few of them are non-zero. It was originally introduced in geophysics, and later by Robert Tibshirani, who coined the term.

In probability theory and statistics, the Poisson distribution is a discrete probability distribution that expresses the probability of a given number of events occurring in a fixed interval of time if these events occur with a known constant mean rate and independently of the time since the last event. It can also be used for the number of events in other types of intervals than time, and in dimension greater than 1.

The multivariate stable distribution is a multivariate probability distribution that is a multivariate generalisation of the univariate stable distribution. The multivariate stable distribution defines linear relations between stable distribution marginals. In the same way as for the univariate case, the distribution is defined in terms of its characteristic function.
In probability theory and statistics, the noncentral beta distribution is a continuous probability distribution that is a noncentral generalization of the (central) beta distribution.
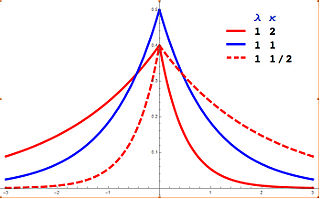
In probability theory and statistics, the asymmetric Laplace distribution (ALD) is a continuous probability distribution which is a generalization of the Laplace distribution. Just as the Laplace distribution consists of two exponential distributions of equal scale back-to-back about x = m, the asymmetric Laplace consists of two exponential distributions of unequal scale back to back about x = m, adjusted to assure continuity and normalization. The difference of two variates exponentially distributed with different means and rate parameters will be distributed according to the ALD. When the two rate parameters are equal, the difference will be distributed according to the Laplace distribution.
In econometrics, the truncated normal hurdle model is a variant of the Tobit model and was first proposed by Cragg in 1971.


