Doon Valley | |
---|---|
East Ayrshire | |
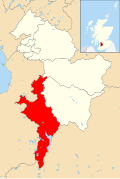
![]() Boundary of Doon Valley in East Ayrshire from 2007–2017. | |
Population | 11,592 (2021) [1] |
Electorate | 8,763 (2024) |
Major settlements | Dalmellington Drongan Patna |
Scottish Parliament constituency | Carrick, Cumnock and Doon Valley |
Scottish Parliament region | South Scotland |
UK Parliament constituency | Ayr, Carrick and Cumnock |
Current ward | |
Created | 2007 |
Number of councillors | 3 |
Councillor | Drew Filson (Independent) |
Councillor | Jennifer Hogg (SNP) |
Councillor | Jim Kyle (Labour) |
Created from | Dalmellington Drongan, Stair and Rankinston Ochiltree, Skares, Netherthird and Craigens Patna and Dalrymple |
Doon Valley is one of the nine electoral wards of East Ayrshire Council. Created in 2007, the ward elects three councillors using the single transferable vote electoral system and covers an area with a population of 11,592 people.
The area was previously a Labour stronghold with the party holding two of the three seats between 2009 and 2017. However, the ward has since been split between Labour and the Scottish National Party (SNP).
The ward was created following the Fourth Statutory Reviews of Electoral Arrangements ahead of the 2007 Scottish local elections. As a result of the Local Governance (Scotland) Act 2004, local elections in Scotland would use the single transferable vote electoral system from 2007 onwards so Doon Valley was formed from an amalgamation of several previous first-past-the-post wards. It contained all of the former Patna and Dalrymple ward as well as part of the former Drongan, Stair and Rankinston, Dalmellington and Ochiltree, Skares, Netherthird and Craigens wards. Doon Valley includes the southernmost part of the council area between its borders with South Ayrshire and Dumfries and Galloway and takes in the towns of Dalmellington, Patna and Drongan. The River Doon runs north-south through the ward and into Loch Doon which lies in the south of the ward. [2] Following the Fifth Statutory Reviews of Electoral Arrangements ahead of the 2017 Scottish local elections, the ward's boundaries were not changed. [3]
Election | Councillors | |||||||
---|---|---|---|---|---|---|---|---|
2007 | Elaine Dinwoodie (Labour) | Drew Filson (SNP) | Jim Sutherland (Ind.) | |||||
2009 | Moira Pirie (Labour) | |||||||
2012 | John Bell (SNP) | |||||||
2017 | Drew Filson (Ind.) | |||||||
2022 | Elaine Stewart (Labour) | Jennifer Hogg (SNP) | ||||||
2024 | Jim Kyle (Labour) |
Party | Candidate | FPv% | Count | |||||||
---|---|---|---|---|---|---|---|---|---|---|
1 | 2 | 3 | 4 | 5 | 6 | 7 | ||||
Labour | Jim Kyle | 32.2 | 516 | 516 | 523 | 537 | 569 | 699 | 826 | |
Conservative | Tracey Clark | 25.5 | 410 | 411 | 412 | 423 | 475 | 506 | ||
SNP | Lorraine Pollock | 23.7 | 379 | 379 | 391 | 400 | 432 | |||
Independent | Jim Ireland | 10.7 | 172 | 175 | 179 | 195 | ||||
Liberal Democrats | Trevor Grant | 4.2 | 68 | 68 | 77 | |||||
Scottish Green | Korin Matthew Vallance | 3.0 | 48 | 49 | ||||||
Independent | Stef McNamara | 0.5 | 9 | |||||||
Electorate: 8,763 Valid: 1,602 Spoilt: 27 Quota: 802 Turnout: 18.6% |
Party | Candidate | FPv% | Count | ||||||
---|---|---|---|---|---|---|---|---|---|
1 | 2 | 3 | 4 | 5 | 6 | ||||
Independent | Drew Filson (incumbent) | 27.9 | 1,077 | ||||||
Labour | Elaine Stewart | 23.1 | 894 | 929 | 974 | ||||
SNP | Jennifer Hogg | 20.8 | 803 | 817 | 826 | 827 | 927 | 1,074 | |
Conservative | Samantha Hainey | 16.7 | 644 | 651 | 681 | 682 | 780 | ||
Independent | John Bell (incumbent) | 8.0 | 311 | 333 | 373 | 375 | |||
Independent | Murray Hendrie | 3.5 | 137 | 146 | |||||
Electorate: 8,932 Valid: 3,866 Spoilt: 59 Quota: 967 Turnout: 43.9% |
Party | Candidate | FPv% | Count | |||||||||
---|---|---|---|---|---|---|---|---|---|---|---|---|
1 | 2 | 3 | 4 | 5 | 6 | 7 | 8 | 9 | ||||
Labour | Elaine Dinwoodie (incumbent) | 21.0 | 801 | 801 | 807 | 828 | 848 | 1,182 | ||||
Conservative | Alison Harper | 18.3 | 698 | 699 | 701 | 718 | 721 | 737 | 756 | 757 | ||
Independent | Drew Filson | 15.5 | 590 | 590 | 596 | 685 | 693 | 777 | 838 | 844 | 1,066 | |
SNP | John Bell (incumbent) | 15.3 | 583 | 583 | 592 | 602 | 935 | 950 | 972 | |||
Labour | Elaine Stewart | 13.0 | 496 | 496 | 502 | 522 | 526 | |||||
SNP | Anne Fairlie | 9.9 | 375 | 375 | 390 | 399 | ||||||
Independent | John Young | 5.4 | 207 | 208 | 213 | |||||||
Scottish Green | Craig Murray | 1.4 | 53 | 54 | ||||||||
Scottish Libertarian | Mark Mitchell | 0.1 | 4 | |||||||||
Electorate: 8,920 Valid: 3,807 Spoilt: 76 Quota: 952 Turnout: 43.5% |
Source: [8]
Party | Candidate | FPv% | Count | ||||||
---|---|---|---|---|---|---|---|---|---|
1 | 2 | 3 | 4 | 5 | 6 | ||||
Labour | Elaine Dinwoodie (incumbent) | 33.1 | 1,171 | ||||||
SNP | John Bell | 22.3 | 790 | 812 | 832 | 950 | |||
Independent | Ian Borthwick | 13.8 | 488 | 501 | 540 | 680 | 708 | ||
Independent | Drew Filson (incumbent) | 12.1 | 427 | 465 | 491 | ||||
Labour | Moira Pirie (incumbent) | 11.9 | 421 | 590 | 613 | 719 | 734 | 984 | |
Conservative | Irene Grant | 5.0 | 178 | 181 | |||||
Electorate: 8,855 Valid: 3,475 Spoilt: 61 Quota: 869 Turnout: 39.2% |
Party | Candidate | FPv% | Count | |
---|---|---|---|---|
1 | ||||
Labour | Moira Pirrie | 50.54 | 1,221 | |
SNP | John Bell | 36.88 | 891 | |
Conservative | Nicholas Martin | 7.28 | 176 | |
Independent | Yvonne Hamilton | 3.48 | 84 | |
Independent | Robert Shennan | 1.82 | 44 | |
Electorate: 9,144 Valid: 2,416 Spoilt: 33 Quota: 1,209 Turnout: 26.8% |
Source: [11]
Party | Candidate | FPv% | Count | |||||
---|---|---|---|---|---|---|---|---|
1 | 2 | 3 | 4 | 5 | ||||
SNP | Drew Filson | 26.0 | 1,221 | |||||
Labour | Elaine Stewart | 17.4 | 814 | 819 | 838 | 1,022 | ||
Independent | Jim Sutherland | 16.6 | 779 | 790 | 915 | 1,036 | 1,089 | |
Labour | Elaine Dinwoodie | 16.5 | 776 | 780 | 826 | 1,097 | 1,802 | |
Labour | Tommy Farrell | 15.1 | 709 | 712 | 734 | |||
Conservative | Margaret Sword | 8.4 | 392 | 396 | ||||
Electorate: 8,976 Valid: 4,691 Spoilt: 96 Quota: 1,173 Turnout: 52.2% |
Source: [12]